


Viewing Statistics
Page 3-31
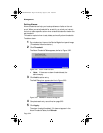
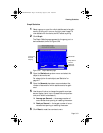
Graph Statistics
1 Select a group or a port for which statistics are to be gath-
ered by clicking on it once on the front panel image. To
view statistics for the device, do NOT select anything.
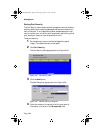
2 Click Graph.
The Graph Statistics page appears for the group, port or
device selected, similar to Figure 3-28.
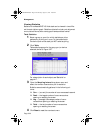
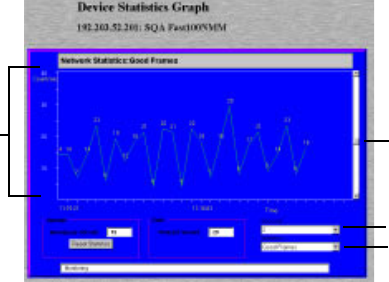
Figure 3-28 Graph Statistics page
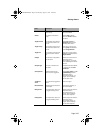
3 Open the Statistics drop-down menu and select the
object to be monitored.
For a description of each object, see “Statistics” on
page 4-17.
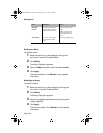
4 Open the Seconds drop-down menu and select the
number of seconds for which statistics are to be gath-
ered.
5 Use the scroll button to change the graph’s count-per-
second display (scroll up to increase the count-per-sec-
ond, scroll down to decrease it).
❏ Average per Second — the average number of
occurrences since opening or resetting the screen.
❏ Peak per Second — the largest number of occur-
rences since opening or resetting the screen.
6 Click Reset to reset the counters to zero.
Scroll Bar
Count-Per-
Second
Display
Statistics
Drop-Down
Menus:
Seconds
100NMM PM book Page 31 Wednesday, August 27, 1997 12:40 PM