9-2
Fish Schools
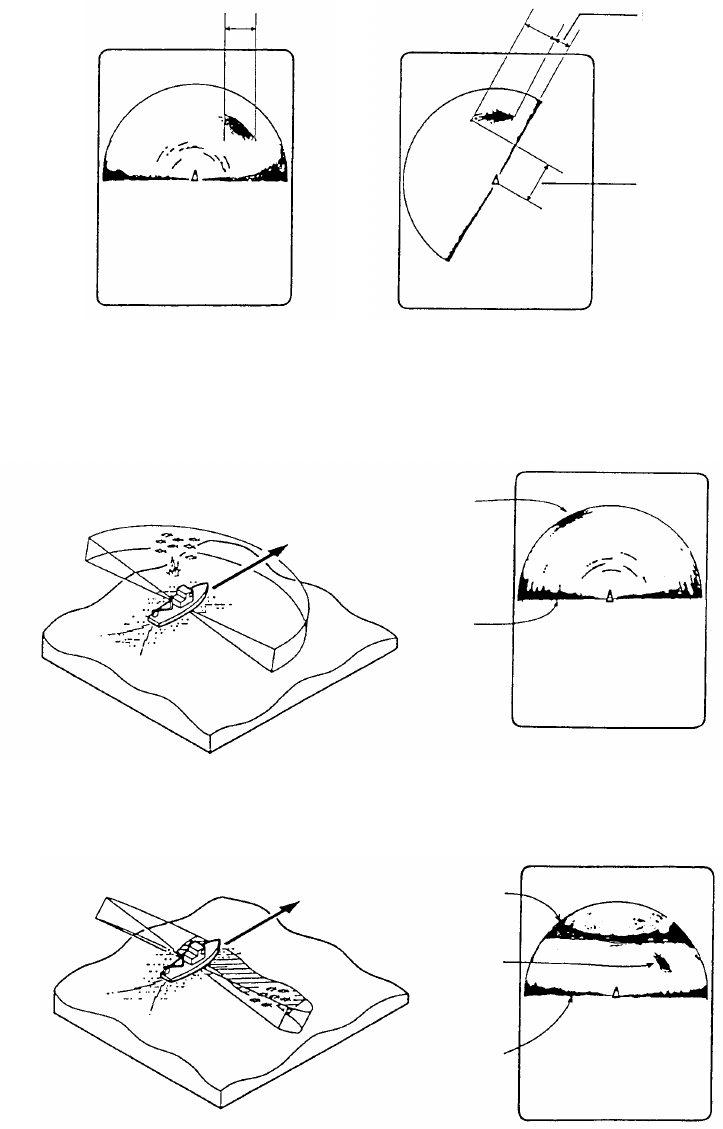
A fish school appears as a mass of echoes on the screen. The
color of the mass shows the density of the fishes and the size of
the mass how they are distributed. In the following figures, the
same fish school is observed with two different tilt angles. From
the left figure, the operator can know the horizontal distribution
of the fish school, and from the right figure the vertical
distribution.
Width (Horizontal distribution)
Tilt:
Sector Center:
Range:
20˚
0˚
400m
Thickness (Vertical distribution)
Depth
Distance
Tilt:
Sector Center:
Range:
90˚
300˚
400m
Surface Fish School
Tilt: 5˚
Seabed
Sea surface
reflections
Bottom Fish School
Tilt: 40˚
Seabed
Fish School
Sea surface
reflections
Figure 9-2 Fish schools


