


Statistical Operations72
Statistics Example
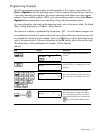
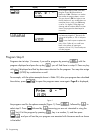
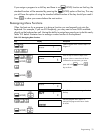
Sales for the last five months are represented by the pairs of values shown below, with the month
number as x, and the sales values as
y. Enter these into the Data menu. Using the Statistics menu for
Predictions, predict sales for month seven. What is the linear regression line? What is the sum of all
the
y values? See Table 12-2 and Table 12-3.
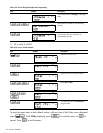
Table 12-2 Statistics Example Months and Sales Values
Month Sales Values
1150
2165
3160
4175
5170