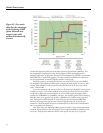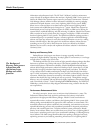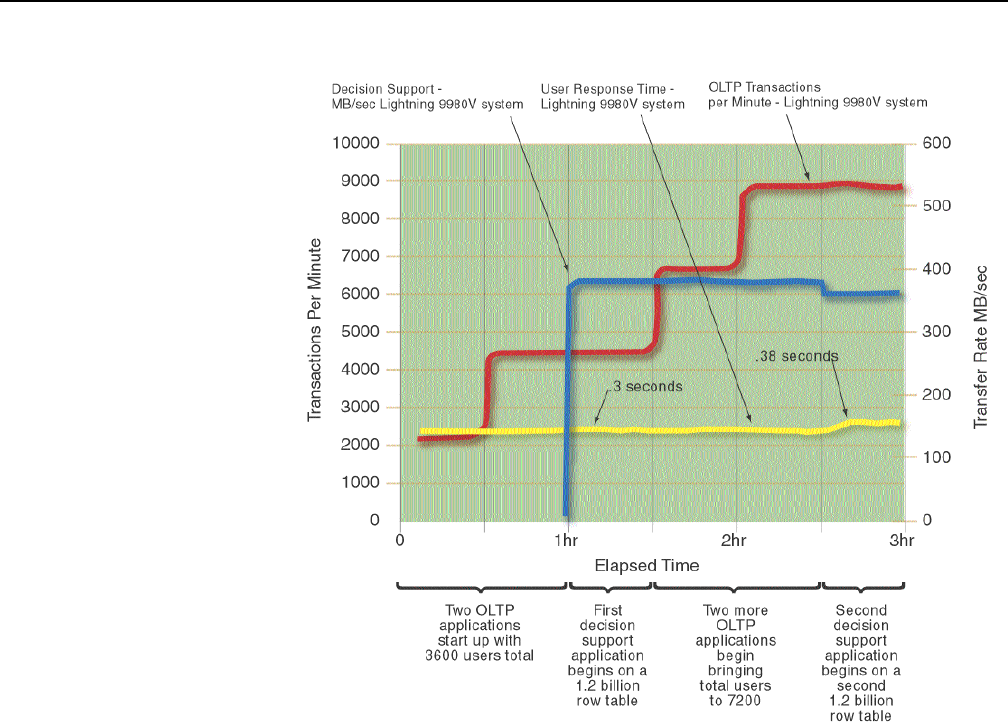
overshot the targeted transfer rate for the DSS system by approximately 50MB/sec. This
was managed by using Hitachi Priority Access software to limit the throughput for a
particular application. At this point, the two OLTP workloads were still able to sustain their
2200TPM each, or 4400TPM aggregate. The three combined workloads were allowed to
run for approximately 30 minutes together to obtain a steady state.
From 90 minutes to 150 minutes of the test, two more OLTP servers were added to
the workload of the Lightning 9980V system, bringing the total number of users to 7200
and the TPM to 8800, a linear increase from the time the first OLTP server was started
with a TPM of 2200.
From 150 minutes to 180 minutes of the test, the second and final DSS system started
its table scan activity. This mixed workload of six total servers (four OLTP and two DSS)
caused only a slight (2.6 percent) reduction in the first DSS system’s throughput from a
transfer rate of 380MB/sec to 370MB/sec. However, the two DSS systems were performing
full tables scans at an aggregate rate of about 740MB/sec or 6.6 million rows per second
each. During this time the total OLTP transaction rate was maintained at 8800TPM;
however, the average user-response time increased insignificantly to 0.38 seconds per
transaction. The 0.08 second increase was considered noise at these levels of measurement,
but is recorded here for discussion.
After three hours, the Lightning 9980V system was under a heavy mixed-performance
workload characterized by a mix of sequential reads at high bandwidths and random reads
and writes. Total processor utilization for the entire system was only 30 to 35 percent.
Figure 23 –Test results
show that the advantages
of the Lightning 9980V
system maintain user
response time while
workloads dramatically
increase.
Hitachi Data Sy s t e m s
32


