4285ch02.fm Draft Document for Review May 4, 2007 11:35 am
40 Linux Performance and Tuning Guidelines
2.1 Introduction
The Enterprise Linux distributions are shipped with many monitoring tools. Some of them deal
with many metrics in a single tool and give us well formatted output for easy understanding of
system activities. Some of them are specific to certain performance metrics (i.e. Disk I/O) and
give us detailed information.
Being familiar with these tools will help to enhance your understand of what’s going on in the
system and to find the possible causes of a performance problem.
2.2 Overview of tool function
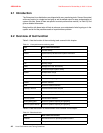
Table 2-1 lists the function of the monitoring tools covered in this chapter.
Table 2-1 Linux performance monitoring tools
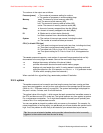
Table 2-2 lists the function of the benchmark tools covered in this chapter.
Table 2-2 Benchmark tools
Tool Most useful tool function
top Process activity
vmstat System activity Hardware and system information
uptime, w Average system load
ps, pstree Displays the processes
free Memory usage
iostat Average CPU load, disk activity
sar Collect and report system activity
mpstat Multiprocessor usage
numastat NUMA-related statistics
pmap Process memory usage
netstat Network statistics
iptraf Real-time network statistics
tcpdump, ethereal Detailed network traffic analysis
nmon Collect and report system activity
strace System calls
Proc file system Various kernel statistics
KDE system guard Real-time systems reporting and graphing
Gnome System Monitor Real-time systems reporting and graphing
Tool Most useful tool function
lmbench Microbenchmark for operating system functions
iozone File system benchmark


