4285ch02.fm Draft Document for Review May 4, 2007 11:35 am
48 Linux Performance and Tuning Guidelines
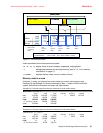
Swap: 2031608 332 2031276
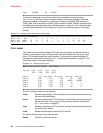
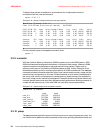
You can also determine much chunks of memory are available in each zone using
/proc/buddyinfo file. Each column of numbers means the number of pages of that order
which are available. In Example 2-10, there are 5 chunks of 2^2*PAGE_SIZE available in
ZONE_DMA, and 16 chunks of 2^4*PAGE_SIZE available in ZONE_DMA32. Remember how
the buddy system allocate pages (refer to “Buddy system” on page 14). This information show
you how fragmented memory is and give you a clue as to how much pages you can safely
allocate.
Example 2-10 Buddy system information for 64 bit system
[root@lnxsu5 ~]# cat /proc/buddyinfo
Node 0, zone DMA 1 3 5 4 6 1 1 0 2 0 2
Node 0, zone DMA32 56 14 2 16 7 3 1 7 41 42 670
Node 0, zone Normal 0 6 3 2 1 0 1 0 0 1 0
2.3.6 iostat
The iostat command shows average CPU times since the system was started (similar to
uptime). It also creates a report of the activities of the disk subsystem of the server in two
parts: CPU utilization and device (disk) utilization. To use iostat to perform detailed I/O
bottleneck and performance tuning, see 3.4.1, “Finding disk bottlenecks” on page 84. The
iostat utility is part of the sysstat package.
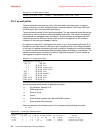
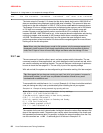
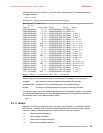
Example 2-11 Sample output of iostat
Linux 2.4.21-9.0.3.EL (x232) 05/11/2004
avg-cpu: %user %nice %sys %idle
0.03 0.00 0.02 99.95
Device: tps Blk_read/s Blk_wrtn/s Blk_read Blk_wrtn
dev2-0 0.00 0.00 0.04 203 2880
dev8-0 0.45 2.18 2.21 166464 168268
dev8-1 0.00 0.00 0.00 16 0
dev8-2 0.00 0.00 0.00 8 0
dev8-3 0.00 0.00 0.00 344 0
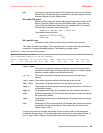
The CPU utilization report has four sections:
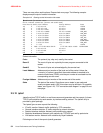
%user Shows the percentage of CPU utilization that was taken up while executing at
the user level (applications).
%nice Shows the percentage of CPU utilization that was taken up while executing at
the user level with a nice priority. (Priority and nice levels are described in
2.3.7, “nice, renice” on page 67.)
%sys Shows the percentage of CPU utilization that was taken up while executing at
the system level (kernel).
%idle Shows the percentage of time the CPU was idle.
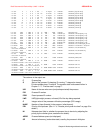
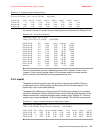
The device utilization report has these sections:
Device The name of the block device.


