4285ch02.fm Draft Document for Review May 4, 2007 11:35 am
50 Linux Performance and Tuning Guidelines
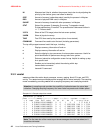
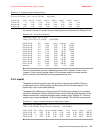
Example 2-13 Using iostat -x -d to analyze the average I/O size
Device: rrqm/s wrqm/s r/s w/s rsec/s wsec/s rkB/s wkB/s avgrq-sz avgqu-sz await svctm %util
dasdc 0.00 0.00 0.00 2502.97 0.00 24601.98 0.00 12300.99 9.83 142.93 57.08 0.40 100.00
The iostat output in Example 2-13 shows that the device dasdc had to write 12300.99 kB of
data per second as being displayed under the kB_wrtn/s heading. This amount of data was
being sent to the disk subsystem in 2502.97 I/Os as shown under w/sin the example above.
The average I/O size or average request size is displayed under avgrq-sz and is 9.83 blocks
of 512 byte in our example. For async writes the average I/O size is usually some odd
number. However most applications perform read and write I/O in multiples of 4kB (for
instance 4kB, 8kB, 16kB, 32kB and so on). In the example above the application was issuing
nothing but random write requests of 4kB, however iostat shows a average request size
4.915kB. The difference is caused by the Linux file system that even though we were
performing random writes found some I/Os that could be merged together for more efficient
flushing out to the disk subsystem.
2.3.7 sar
The sar command is used to collect, report, and save system activity information. The sar
command consists of three applications: sar, which displays the data, and sa1 and sa2, which
are used for collecting and storing the data. The sar tool features a wide range of options so
be sure to check the man page for it. The sar utility is part of the sysstat package.
With sa1 and sa2, the system can be configured to get information and log it for later analysis.
To accomplish this, add the lines to /etc/crontab (Example 2-14). Keep in mind that a default
cron job running sar daily is set up automatically after installing sar on your system.
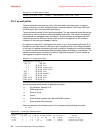
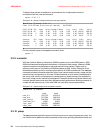
Example 2-14 Example of starting automatic log reporting with cron
# 8am-7pm activity reports every 10 minutes during weekdays.
*/10 8-18 * * 1-5 /usr/lib/sa/sa1 600 6 &
# 7pm-8am activity reports every an hour during weekdays.
0 19-7 * * 1-5 /usr/lib/sa/sa1 &
# Activity reports every an hour on Saturday and Sunday.
0 * * * 0,6 /usr/lib/sa/sa1 &
# Daily summary prepared at 19:05
5 19 * * * /usr/lib/sa/sa2 -A &
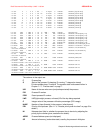
The raw data for the sar tool is stored under /var/log/sa/ where the various files represent the
days of the respective month. To examine your results, select the weekday of the month and
the requested performance data. For example, to display the network counters from the 21st,
use the command sar -n DEV -f sa21 and pipe it to less as in Example 2-15.
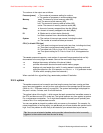
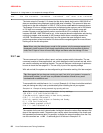
Note: When using the default async mode for file systems, only the average request size
displayed in iostat is correct. Even though applications perform write requests at distinct
sizes, the I/O layer of Linux will most likely merge and hence alter the average I/O size.
Tip: We suggest that you have sar running on most if not all of your systems. In case of a
performance problem, you will have very detailed information at hand at very small
overhead and no additional cost.


