4285ch02.fm Draft Document for Review May 4, 2007 11:35 am
42 Linux Performance and Tuning Guidelines
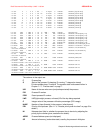
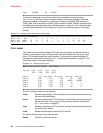
NI Niceness level (that is, whether the process tries to be nice by adjusting the
priority by the number given; see below for details).
SIZE Amount of memory (code+data+stack) used by the process in kilobytes.
RSS Amount of physical RAM used, in kilobytes.
SHARE Amount of memory shared with other processes, in kilobytes.
STAT State of the process: S=sleeping, R=running, T=stopped or traced,
D=interruptible sleep, Z=zombie. The process state is discussed further in
1.1.7, “Process state”.
%CPU Share of the CPU usage (since the last screen update).
%MEM Share of physical memory.
TIME Total CPU time used by the process (since it was started).
COMMAND Command line used to start the task (including parameters).
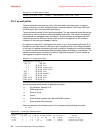
The top utility supports several useful hot keys, including:
t Displays summary information off and on.
m Displays memory information off and on.
A Sorts the display by top consumers of various system resources. Useful for
quick identification of performance-hungry tasks on a system.
f Enters an interactive configuration screen for top. Helpful for setting up top
for a specific task.
o Enables you to interactively select the ordering within top.
r Issues renice command
k Issues kill command
2.3.2 vmstat
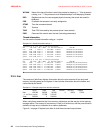
vmstat provides information about processes, memory, paging, block I/O, traps, and CPU
activity. The vmstat command displays either average data or actual samples. The sampling
mode is enabled by providing vmstat with a sampling frequency and a sampling duration.
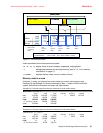
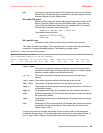
Example 2-2 Example output from vmstat
[root@lnxsu4 ~]# vmstat 2
procs -----------memory---------- ---swap-- -----io---- --system-- ----cpu----
r b swpd free buff cache si so bi bo in cs us sy id wa
0 1 0 1742264 112116 1999864 0 0 1 4 3 3 0 0 99 0
0 1 0 1742072 112208 1999772 0 0 0 2536 1258 1146 0 1 75 24
0 1 0 1741880 112260 1999720 0 0 0 2668 1235 1002 0 1 75 24
0 1 0 1741560 112308 1999932 0 0 0 2930 1240 1015 0 1 75 24
1 1 0 1741304 112344 2000416 0 0 0 2980 1238 925 0 1 75 24
0 1 0 1741176 112384 2000636 0 0 0 2968 1233 929 0 1 75 24
0 1 0 1741304 112420 2000600 0 0 0 3024 1247 925 0 1 75 24
Attention: In sampling mode consider the possibility of spikes between the actual data
collection. Changing sampling frequency to a lower value may evade such hidden spikes.
Note: The first data line of the vmstat report shows averages since the last reboot, so it
should be eliminated.


