


targetNamespace="http://www.ibm.com/xmlns/prod/websphere/scdl/eis/6.0.0:JCAAdapter"
xmlns:er="http://www.ibm.com/xmlns/prod/websphere/recovery/6.0.0/es/eventpayloads"
>
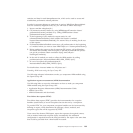
<Event name="ResourceAdapter.Polling.STARTED" situationType=
"STATUS" situationCategory="ReportSituation"
reasoningScope="EXTERNAL" parent="WBI.MonitoringEvent">
<Payload>
<Data name="PollFrequency" type="int" minOccurs="0" maxOccurs="1"/>
<Data name="PollQuantity" type="int" minOccurs="0" maxOccurs="1"/>
</Payload>
</Event>
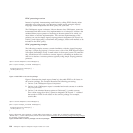
3. Invoke Events
import com.ibm.j2ca.extension.logging.internal.cbe.EngineData;
...
CBEEngineData engineData = CBEEngineDataFactory.getEngineDataForEventType("Polling");
//This will instantiate the EngineData class for user defined event e.g "Polling".
engineData.setValue("EventAction","STARTED");
//This will set the user defined action e.g. "Started"
engineData.setValue("PollFrequency", activationSpec.getPollPeriod());
//This will set the user defined arg
engineData.setValue("PollQuantity", activationSpec.getPollQuantity());
//This will set the user defined arg
Performance monitoring infrastructure (PMI) for resource adapters:
The Performance Monitoring Infrastructure (PMI) is the underlying framework in
WebSphere Application Server that gathers performance data from various runtime
resources such as adapters.
The purpose of monitoring is to observe the progress of execution of WebSphere
Business Integration applications, and the WebSphere Business Integration system
itself, and publish the results of this observation. By using Performance Monitoring
Infrastructure (PMI), you can observe the progress of adapters running in the
server runtime environment and other business integration applications, and
publish the results. PMI collects data, such as average response time and total
number of requests, from various components in the server, and organizes the data
into a tree structure. You can observe data through the Tivoli Performance Viewer,
a graphical monitoring tool that is included with WebSphere Application Server..
You can monitor the performance of the adapters by having PMI collect data at the
following points:
v
v InboundEventRetrieval:
Will monitor performance of retrieving events from the EIS. It enables
monitoring of entering, exiting, failing of the EventManager.getEvents() method.
v InboundEventDelivery:
Will monitor the performance when resource adapter deliver data to the
endpoint, which conveys changes in or general information from the EIS. It
enables monitoring of entering, exiting, failing of the EventSender.doSendEvent()
method.
v Outbound:
Will monitor the performance of outbound processing of a resource adapter. It
enables monitoring of entering, exiting, failing of the WBIInteraction.execute()
method.
Extending PMI on WebSphere Process Server:
To add a user-defined element or method into the list of monitorable components
you need to modify code and schema files.
WebSphere Adapter development overview 185