


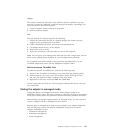
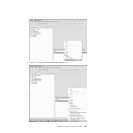

Adding a value to the Datapool
This adds the data to Datapool.
When you want to use this input data again, select Use Value from Pool.
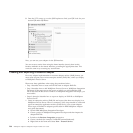
Using an execution trace
The test client you installed provides you with a trace of the execution and the
data path of the test. You can optionally load any previously saved execution trace
into the test client. This enables you to renew a test session at the point where you
saved the execution.
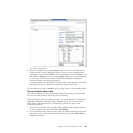
The procedures below describe how to load and save an execution trace file.
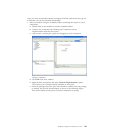
1. Select the module from the Navigation window, right-click and select Test >
Load Execution Trace.
2. In the Choose a file list box, expand the folder that contains the execution trace
file that you want to load and select the execution trace file. (By default,
execution trace files have a file extension of .wbiexetrace.)
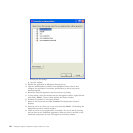
3. Click Finish. The selected execution trace opens in a new instance of the test
client.
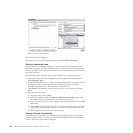
4. Save the execution trace.
a. In the test client, enter Ctrl-S.
b. In the Save dialog, under the Enter or select the parent folder field, select
the folder where you want to save your execution trace file.
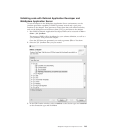
c. Enter the name that you want to assign to the execution trace file in the File
name field.
d. Click Finish. The execution trace file is saved to the folder that you selected
and the test client page tab changes to the name of the execution trace file.
e. Enter Ctrl-S in the test client to re-save the file.
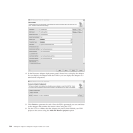
Testing inbound functionality
To test inbound functionality, you configure an inbound instance of your adapter
with an export monitor. You then run an outbound adapter instance to generate an
event of interest for your inbound adapter.
200 WebSphere Adapters: WebSphere Adapter Toolkit User Guide