


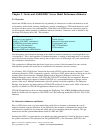
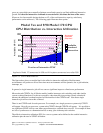
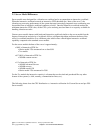
grows at a rate which can eventually eliminate server/batch capacity and limit additional interactive
growth. It is best for interactive workloads to execute below (less than) the knee of the curve.
(However, for those models having the knee at 1/3 of the total interactive capacity, satisfactory
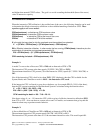
performance can be achieved.) The following graph illustrates these points.
Announced
Capacities
Stop Here!
0 Full7/6
Fraction of Interactive CPW
0
20
40
60
80
100
Available CPU %
available
overhead
interactive
Model 7xx and 9/98 Model 170 CPU
CPU Distribution vs. Interactive Utilization
Available for
Client/Server
Knee
Applies to: Model 170 announced in 9/98 and ALL systems announced on or after 2/99
Figure 2.1. Server Model behavior
The figure above shows a straight line for the effective interactive utilization. Real/customer
environments will produce a curved line since most environments will be dynamic, due to job initiation,
interrupts, etc.
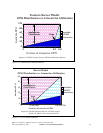
In general, a single interactive job will not cause a significant impact to client/server performance
Microcode task CFINTn, for all iSeries models, handles interrupts, task switching, and other similar
system overhead functions. For the server models, when interactive processing exceeds a threshold
amount, the additional overhead required will be manifest in the CFINTn task. Note that a single
interactive job will not incur this overhead.
There is one CFINTn task for each processor. For example, on a single processor system only CFINT1
will appear. On an 8-way processor, system tasks CFINT1 through CFINT8 will appear. It is possible to
see significant CFINT activity even when server/interactive overhead does not exist. For example if there
are lots of synchronous or communication I/O or many jobs with many task switches.
The effective interactive utilization (EIU) for a server system can be defined as the useable interactive
utilization plus the total of CFINT utilization.
IBM i 6.1 Performance Capabilities Reference - January/April/October 2008
© Copyright IBM Corp. 2008 Chapter 2 - Server Performance Behavior 19