


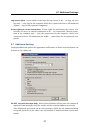


41
Chapter 7
Viewing and Analysis of Captured Data
Kerio Network Monitor offers several tools for the presentation and analysis of the cap-
tured data. These functions can be chosen from the View menu or directly from a toolbar
icon (the order of the functions is the same):
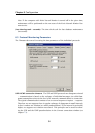
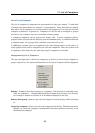
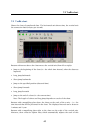
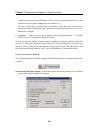
Traffic chart Chart of the transferred data volume. You can display a transferred data
for the chosen time interval in several graphical representations. The incoming and
outgoing data, the particular computers, groups etc. can be watched separately.
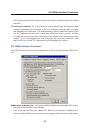
Current connections Displays current connections from particular computers. The
window content is periodically refreshed.
Scanned data Displays the logged data from specific protocols (WWW pages, e-mail
messages, FTP sessions etc.)
Status window Status of the Kerio Network Monitor Daemon service (logged user,
statistics of captured packets, disk volume occupied by the stored data...)
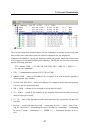
Report Creates a well-structured table from the transferred volume of data according
to the specified parameters (time period, type of operation, level of details...)
Connection log Displays the log of connections from particular computers (history of
the Current connections window)
HTTP log Log of requests from particular computers to WWW pages, or to all HTTP
objects, respectively. (see chapter
6.7)
Mail log Log of the captured e-mail messages (e-mail address of a sender and recipient,
subject, and message size)
ICQ log Log of ICQ messages (ICQ numbers, user nicknames and message contents)
Error log Log of errors and warnings. The Kerio Network Monitor administrator should
study this log regularly and try to eliminate detected errors and problems.