


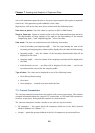

7.2 Traffic chart
45
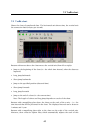
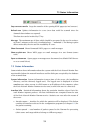
7.2 Traffic chart
Shows the chart of transferred data. The horizontal axis shows time, the vertical axis
the connection load (in bytes per second).
Buttons with arrows above the chart moves the vertical axis (from left to right):
• Jump to the beginning of the chart (i.e. the whole time interval, when the data was
captured)
• Long jump backwards
• Short jump backwards
• Jump to the specified position (date and time)
• Short jump forwards
• Long jump forwards
• Jump to the end of a chart (i.e. the current time)
Note: The length of a short and long jump depends on a scale of the chart.
Buttons with a magnifying glass above the chart set the scale of the x-axis — i.e. the
time interval that will be presented in the chart. The displayed interval can be between
1 minute and 1 year.
Buttons with a magnifying glass right to the chart set the scale of the vertical axis.
Moreover, there exists an option Auto, which automatically adjusts the scale of this