


Chapter 7 Viewing and Analysis of Captured Data
46
axis to the maximum captured value in the given representation (the option is implicitly
turned on). This guarantees good readability of the chart.
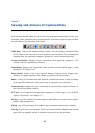
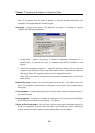
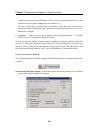
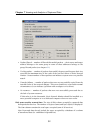
Right mouse click in the chart area shows a menu with the following items:
Save chart as picture Saves the chart as a picture in JPEG or BMP format.
Zoom in, Zoom out Zooms in/zooms out the scale of the horizontal axis (time interval).
The functionality of these options is the same as the functionality of the buttons
“magnifying glass +” and “magnifying glass -” above the chart.
View mode The user can switch between the following view modes:
• Sum of incoming and outgoing traffic — One line representing the sum of the
incoming and outgoing data volume will be displayed in the chart (default setting)
• Incoming traffic — only the volume of the incoming (downloaded) data will be
displayed in the chart
• Outgoing traffic — only the volume of the outgoing (sent) data will be displayed in
the chart
• Both directions at once — two lines will be displayed in the chart — one for the
incoming and the second for the outgoing traffic
Type of chart The chart can be displayed in one of the following forms:
• Draw lines (default setting)
• Draw bars
• Draw polygons — stacked area (area under the line)
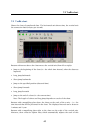
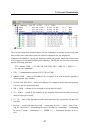
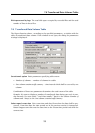
7.3 Current Connections
The Current connections item shows the window with current connections. This window
contains information about the current TCP connections, or UDP and ICMP pseudocon-
nections, respectively, from particular stations in a local network.
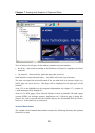
The Current connections window contains a tree with two top-level items:
• All computers — this option shows all computers which are in the Kerio Network
Monitor database (see chapter 7.1).
• Groups — particular groups (defined in the list of computers) are presented here.