


Chapter 8 Web Interface
60
If you want to display data about all computers in a local network, log in the login
section. Information about all computers becomes accessible after the successful login.
In the other case, the WWW interface remains in the anonymous mode.
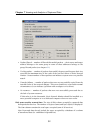
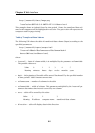
8.2 Page Main
This section shows information about the system where the Kerio Network Monitor Dae-
mon runs (system time, license information, used disk space...).
Information on this page (with a few exceptions) corresponds to the Engine status & info
window — see chapter 7.5.
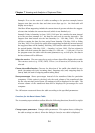
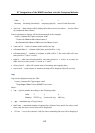
8.3 Page Chart
Page chart displays a chart of transferred volume data (as Traffic chart window — see
chapter 7.6).
Options in a left part of the page set chart parameters:
Select red / blue / green sequence Chart on this WWW page can display at most
3 lines (red, green and blue) - a type of displayed information can be set for each
line. The choices are:
• All computers — total volume of transferred data for all computers
• Name of computer or group — volume of transferred data for the selected com-
puter of group
• <none> — line will not be displayed. This option is available only for the second
and the third line (i.e. the green and blue line).
Select chart width Time interval that will be displayed in the chart (from 1 minute to
1 year).
Show Shows the chart with the specified parameters.
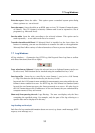
Row of buttons is displayed above the chart. They move the chart content alongside the
horizontal axis. Middle button Refresh is used to refresh the chart (the chart on a WWW
page is not automatically refreshed because of technical reasons).
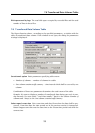
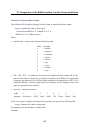
8.4 Page Report
This page corresponds to the Accounting report window. Before the page is opened, the
options for table parameters settings are displayed: