


EDS-518A Series User’s Manual Featured Functions
3-61
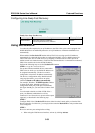
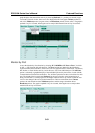
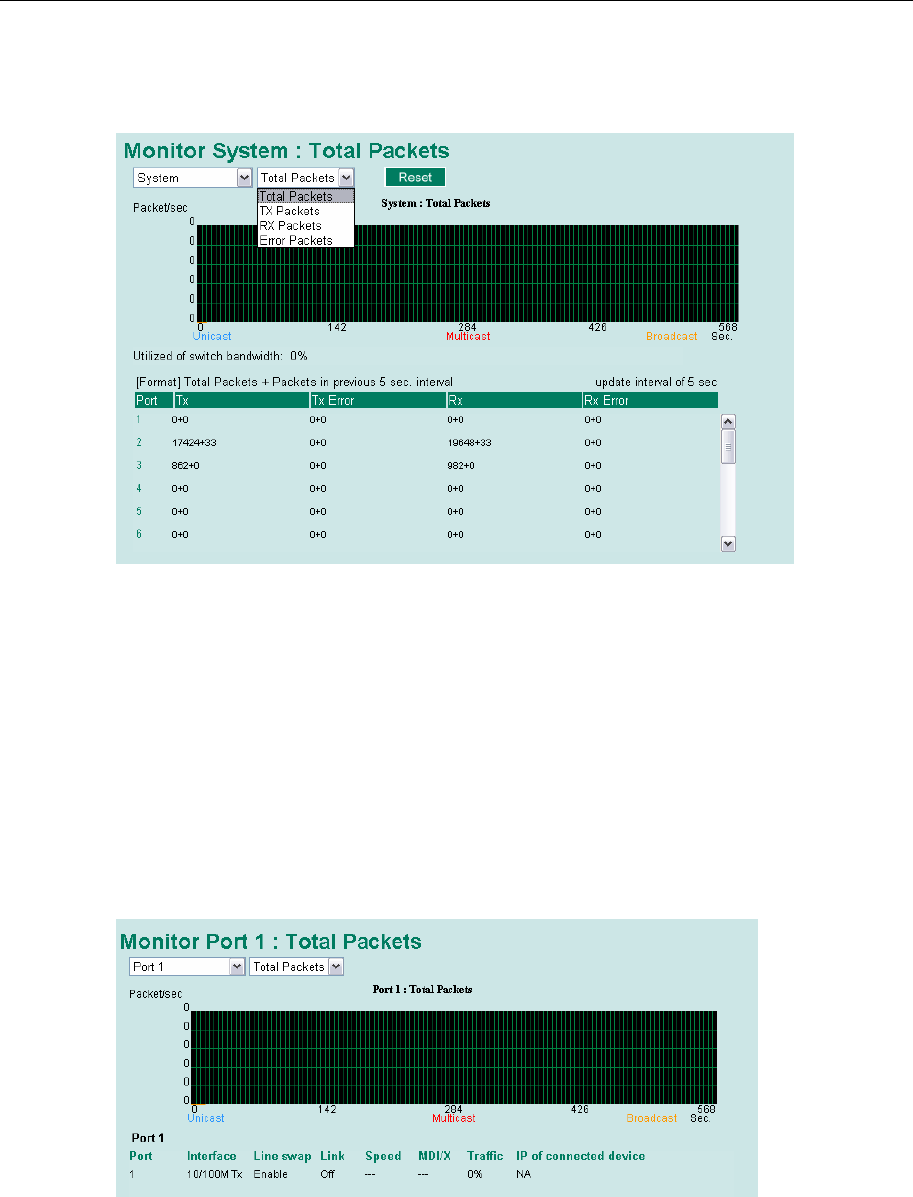
graph displays data transmission activity by showing Packets/s (i.e., packets per second, or pps)
versus sec. (seconds). In fact, three curves are displayed on the same graph: Unicast packets (in
red color), Multicast packets (in green color), and Broadcast packets (in blue color). The graph is
updated every few seconds, allowing the user to analyze data transmission activity in real-time.
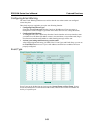
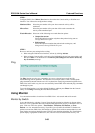
Monitor by Port
Access the Monitor by Port function by selecting ALL 10/100M or 1G Ports or Port i, in which
i= 1, 2, …, G2, from the left pull-down list. The Port i options are identical to the Monitor by
System function discussed above, in that users can view graphs that show All Packets, TX Packets,
RX Packets, or Error Packets activity, but in this case, only for an individual port.
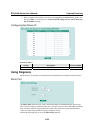
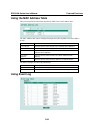
The All Ports
option is essentially a graphical display of the individual port activity that can be viewed with the
Console Monitor function discussed above. The All Ports option shows three vertical bars for each
port. The height of the bar represents Packets/s for the type of packet, at the instant the bar is
being viewed. That is, as time progresses, the height of the bar moves up or down so that the user
can view the change in the rate of packet transmission. The blue colored bar shows Unicast
packets, the red colored bar shows Multicast packets, and the orange colored bar shows
Broadcast packets. The graph is updated every few seconds, allowing the user to analyze data
transmission activity in real-time.