


Revision 071108
Page 32 of 102
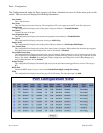
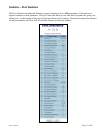
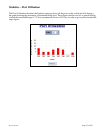
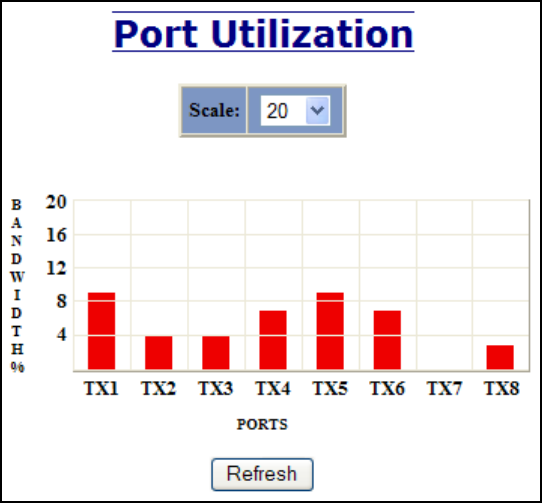
Statistics – Port Utilization
The Ports Utilization tab under the Statistics category shows all the ports on the switch and will display a
bar graph showing the percentage of bandwidth being used. These figures and bars are for a general feeling
of what the bandwidth usage is. N-Tron recommends the use of N-View in order to get a precise bandwidth
usage figure.