


OM-550 DOS Software u18u
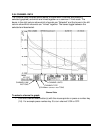
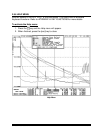
2.8.5 DATA GRAPH
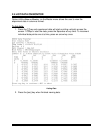
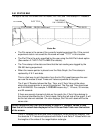
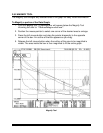
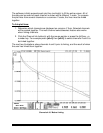
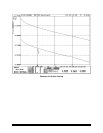
The Data Graph is where the data for each channel on the OM-550 is graphed in XY
format. The Data Graph X (horizontal) axis represents time (or point #) and the Y
(vertical) axis shows the values of the data points. The values are also shown in the X-
cursor Data Table section of the Channel Data location.
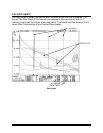
X-CURSOR
DATA TABLE
X-CURSORS
DATA PLOTS
Data Graph