


23
(c) Software Trace Function
Note: This function can be supported with SHC compiler V7.0 and later.
When a specific instruction is executed, the PC value at execution and the contents of one
general register are acquired by trace. Describe the Trace(x) function (x is a variable name) to
be compiled and linked beforehand. For details, refer to the SHC manual.
When the load module is loaded on the emulator and a valid software trace function is
executed, the PC value that has executed the Trace(x) function, the general register value for x,
and the source lines are displayed.
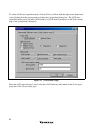
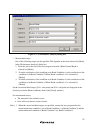
To activate the software trace function, select the [Software trace] check box in the [AUD
function] group box of the [Trace mode] page.
Notes on AUD Trace:
1. When the trace display is performed during user program execution, the mnemonics, operands,
or source is not displayed.
2. The AUD trace function outputs the differences between newly output branch source addresses
and previously output branch source addresses. The window trace function outputs the
differences between newly output addresses and previously output addresses. If the previous
branch source address is the same as the upper 16 bits, the lower 16 bits are output. If it
matches the upper 24 bits, the lower 8 bits are output. If it matches the upper 28 bits, the lower
4 bits are output.
The emulator regenerates the 32-bit address from these differences and displays it in the
[Trace] window. If the emulator cannot display the 32-bit address, it displays the difference
from the previously displayed 32-bit address.
3. If the 32-bit address cannot be displayed, the source line is not displayed.
4. In the SH7630 E10A emulator, when multiple loops are performed to reduce the number of
AUD trace displays, only the IP counts up.
5. In the SH7630 E10A emulator, the maximum number of trace display pointers is as follows:
When HS7630KCM02H is used: D'8191 to -0
When HS7630KCI02H is used: D'32767 to -0
However, the maximum number of trace display pointers differs according to the AUD trace
information to be output. Therefore, the above pointers cannot be always acquired.
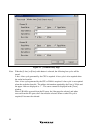
6. When [User] is specified in the [UBC mode] list box in the [Configuration] window, the AUD
trace is not acquired. In this case, exit the [Trace] window.
7. When the branch information for the odd address is acquired, it may be displayed as the
software trace.
8. If a completion-type exception occurs during exception branch acquisition, the next address to
the address in which an exception occurs is acquired.
9. For the AUD non-realtime trace, the written access may be executed again. If this is a
problem on the user system, do not use the non-realtime trace.