


EL-9900 Graphing Calculator
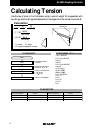
Electric Power Consumed on an AC Circuit
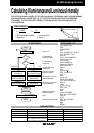
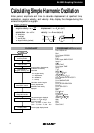
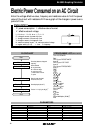
Enter the voltage effective value, frequency and resistance value to find the power
value of the circuit with resistance R. Draw a graph of the changes in power over a
period of time.
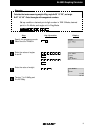
Calculation
FLOWCHART
PARAMETERS
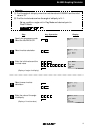
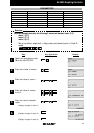
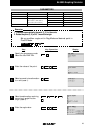
PROGRAMME LIST
(REAL MODE)
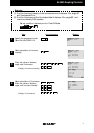
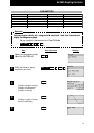
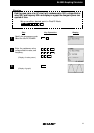
Data entry
Calculation of power
Calculation of range
Display of power
Display of graph
Start
End
Enter data (resistance, voltage and
frequency).
Power calculated.
W = angular velocity
M = maximum voltage
N = maximum current
I = effective value of current
Z = power
Range for graph calculated.
Xmax, Xscl, Ymax, Yscl
Power displayed. (value of Z)
Function: Y = N M (sin (W X))
2
Rad
Print "Input RESISTANCE
Input R
Print "Input VOLTAGE
Input V
Print "Input FREQUENCY
Input F
R T
V D
F S
2 π S W
D √2 M
M/T N
N/√2 I
D I Z
1/S Xmax
Xmax/10 Xscl
N M Ymax
Ymax/10 Yscl
Print "WATT=
Print Z
Wait
0 Xmin
0 Ymin
Draw N M (sin (W X))
2
End
P : power consumption I : effective value of current
V : effective value of voltage
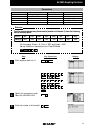
Name of parameter
S
I
T
D
W
N
M
Xmax
Content
frequency
effective value of current
resistance value
effective value of voltage
angular velocity
maximum value of current
maximum value of voltage
maximum value of x-axis
Name of parameter
Xscl
Ymax
Yscl
V
R
F
Z
Content
scale of x-axis
maximum value of y-axis
scale of y-axis
input of voltage
input of resistance value
input of frequency
value of power
I0 = N
•
sin ω
•
t V0 = M
•
sin ω
•
t P0 = l0
•
V0
P0 : change in amount of power with time
I
0 : change in amount of current with time
V
0: change in amount of voltage with time
N: maximum value of current M: maximum value of voltage
ω: angular velocity (2 π S) t : time S : frequency
R
I
V
Title : AC POWER
10