Sharp EL-9900 Calculator User Manual


EL-9900 Graphing Calculator
Moving Average
Plot a moving average graph which helps to understand how the results change over a
specified period. The progress of sales and amounts of consumption and production can
also be seen.
Calculation
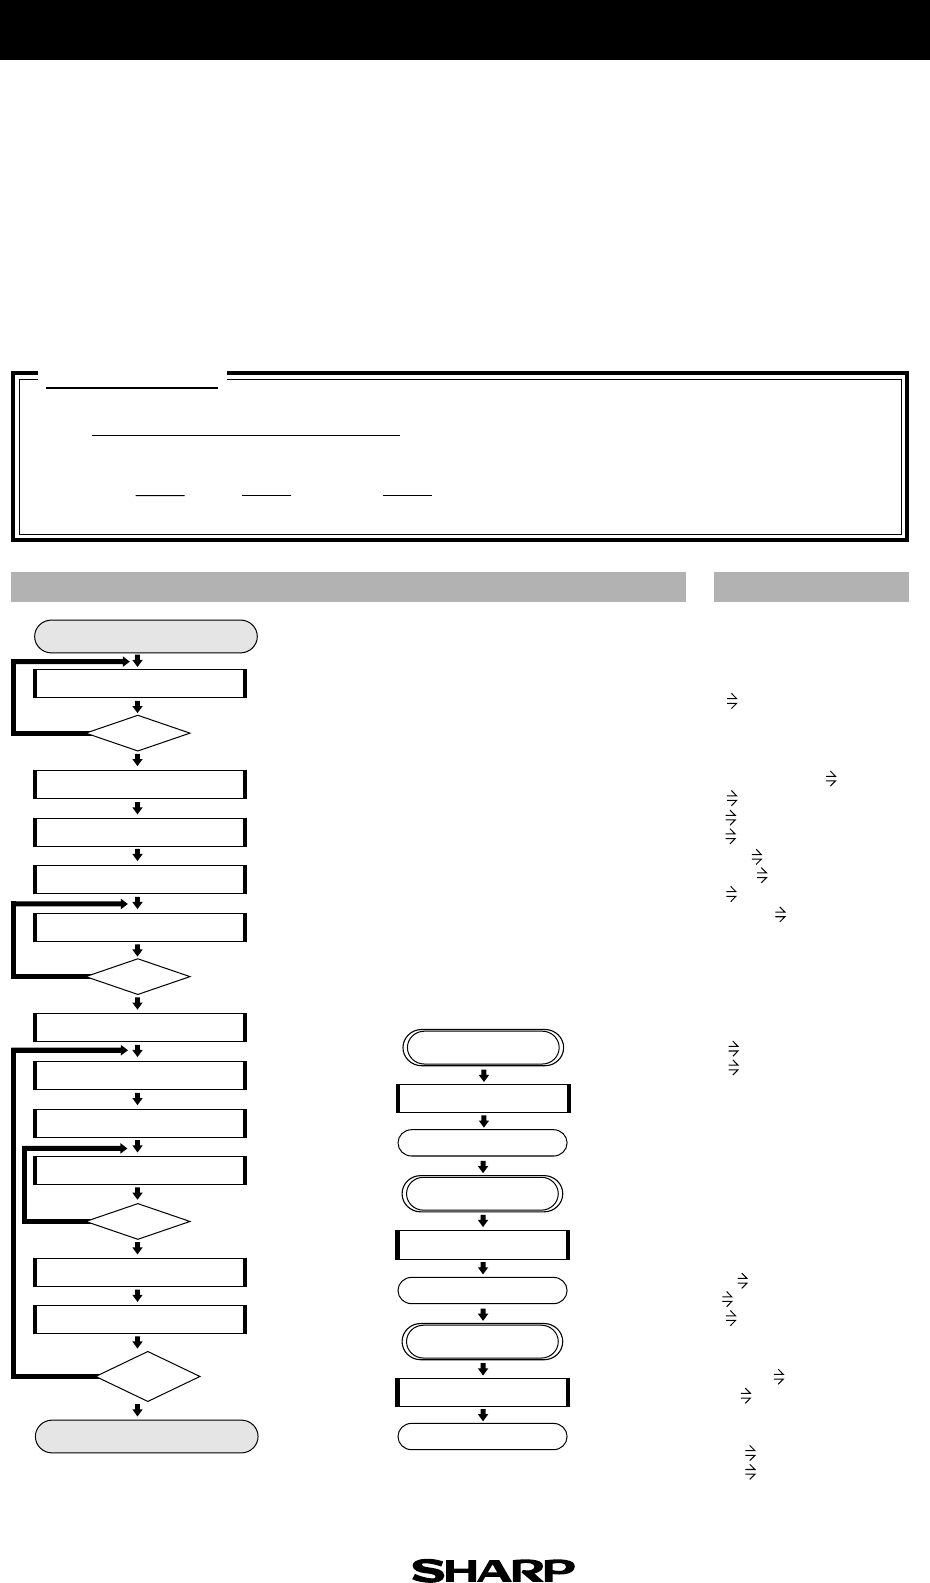
FLOWCHART
PROGRAMME LIST
Entry of number of divisions
Start
End
COUNT
MOVINGSUM
Setting of calculation range
Enter unit for calculating average.
Returns to entry of no. of divisions if the number
of divisions more than no. of data.
Range for graph set.
I = 0, K = int (M/2)
First calculation. Jumps to subroutine.
Jumps to subroutine.
Number of calculation times of moving sum judged.
Repeated until calculation of no. of divisions performed.
X = K, Y = H
Jumps to
subroutine.
Subroutine
Setting of counter
Subroutine
Calculation of
moving sum
Subroutine
Calculation of
average
Jumps to
subroutine.
Jumps to
subroutine.
Line displayed.
Judgment of end.
Label MAIN
Print "Input DIVISION
Input D
D M
1_Stats L1
If Mn Goto MAIN
Rem RANGE
(xmax-xmin)/10 Yscl
0 Xmin
n Xmax
1 Xscl
xmin Ymin
xmax Ymax
0 I
int (M/2) K
Gosub COUNT
Label LOOP1
Gosub MOVINGSUM
If MJ Goto LOOP1
Gosub AVERAGE
Label LOOP2
K X
H Y
Gosub COUNT
Label LOOP3
Gosub MOVINGSUM
If (I+M)>J Goto LOOP3
Gosub AVERAGE
Line (X, Y, K, H)
If K(n-int (M/2))
Goto LOOP2
Wait
End
Label COUNT
I+1 I
I J
0 S
Return
Label MOVINGSUM
S+L1(J) S
J+1 J
Return
Label AVERAGE
S/M H
K+1 K
Return
Hi =
( I = 1 +
M-1
, 2 +
M-1
, ... , n +
M-1
)
M
Calculation
Gosub count
Gosub MOVINGSUM
N
I = I + 1, J = I, S = 0
Return
AVERAGE
Return
Return
Calculation of moving sum
Calculation of moving average
MAIN
LOOP1
LOOP2
LOOP3
Xi-(M-1) / 2 + ... + Xi + ... Xi+(M-1) / 2
H
i
: moving average
M : number of divisions
X
i
: data
n : number of data
M>=n
Gosub AVERAGE
Gosub COUNT
Gosub MOVINGSUM
Gosub AVERAGE
Display of line
Substitution
N
M>=J
N
Y
Y
Y
Y
(I+M)>J
N
K
(n-int(M/2))
2 2 2
Title : MVIN AVG
16