


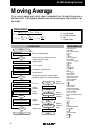

EL-9900 Graphing Calculator
6
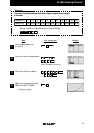
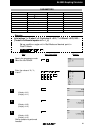
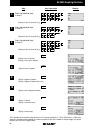
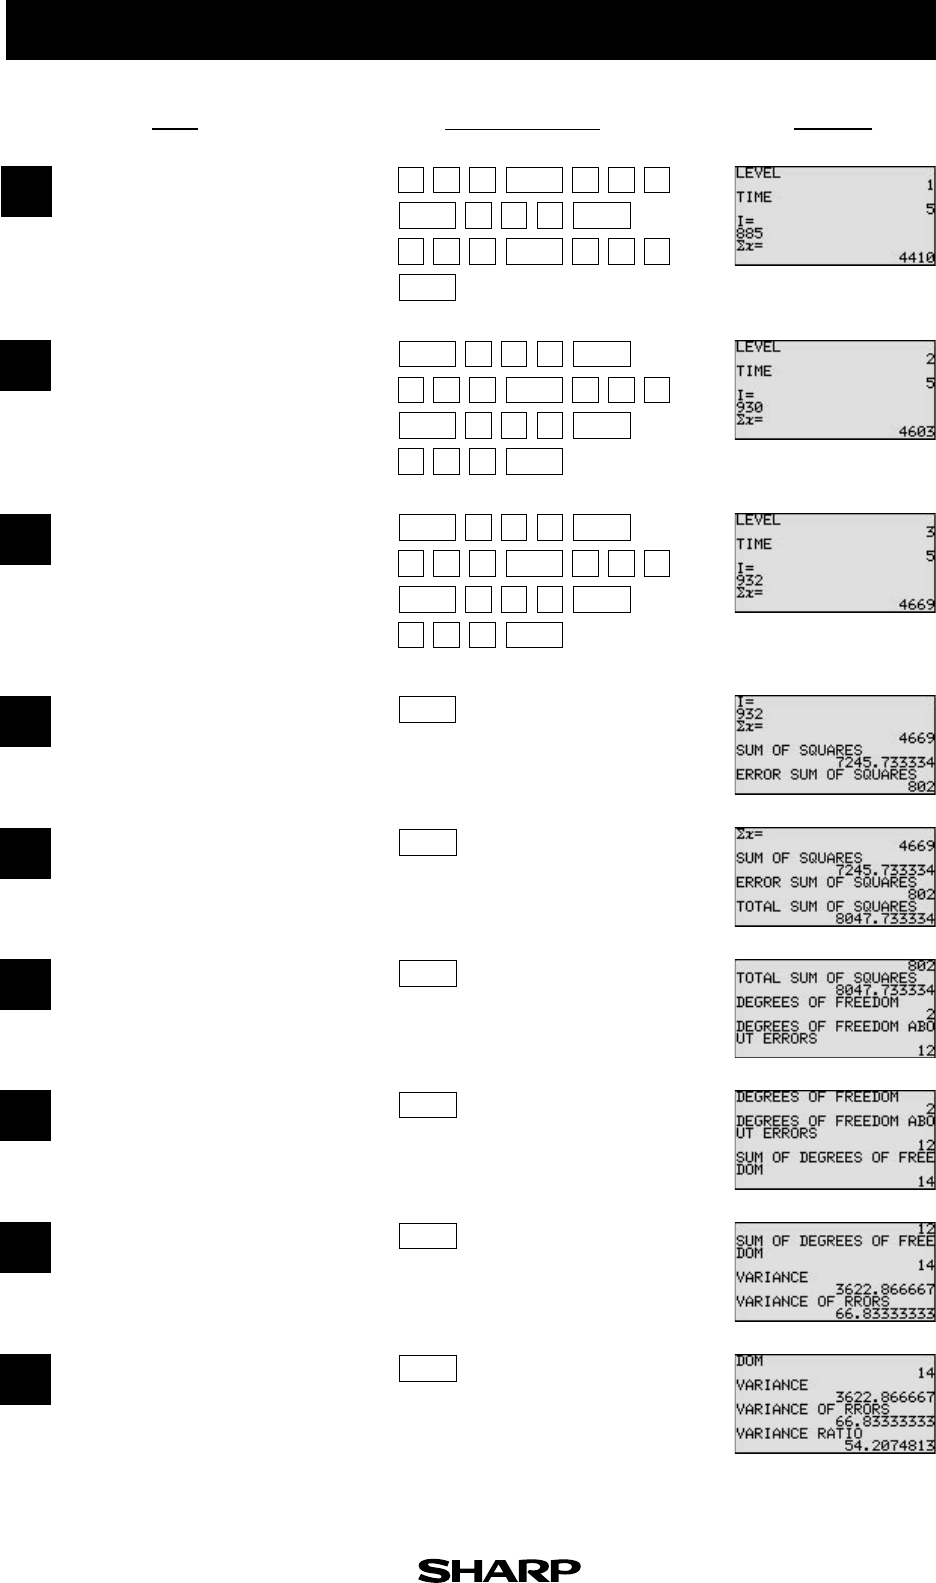
DisplayStep
Key Operation
4
5
(Display of total of hormone 10 g)
(Display of total of hormone 20 g)
(Display of total of hormone 30 g)
7
(Display of sum of squares)
(Display of error sum of squares)
8
(Display of sum of squares)
9
(Display of degrees of freedom)
(Display of degrees of freedom about errors)
10
(Display of sum of degrees of freedom)
11
(Display of variance)
(Display of variance of errors)
12
(Display of variance ratio)
The F-distribution chart shows that the value of F of upper probability P = 5% is 3.89. Since f > 3.98 in this
example, the relationship between the hormone amount and the increase of mouse weight is a causal
relation with 5% level of significance.
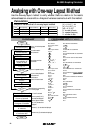
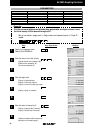
Enter the statistical data
in level 1.
Enter the statistical data
in level 2.
Enter the statistical data
in level 3.
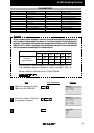
24
2
ENTER
88
4
ENTER
68
8
ENTER
88
3
ENTER
29
5
ENTER
19
2
ENTER
19
3
ENTER
39
9
ENTER
3
9
0
ENTER
49
2
ENTER
39
529
329
588
198
ENTER
ENTER
ENTER
ENTER
ENTER
ENTER
ENTER
ENTER
ENTER
ENTER
ENTER
ENTER
0
ENTER
39