


Super Systems Inc. Page 51 SDS Data Logger Manual #4565 Rev D
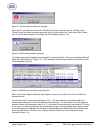
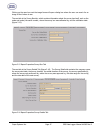
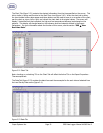
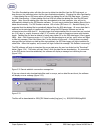
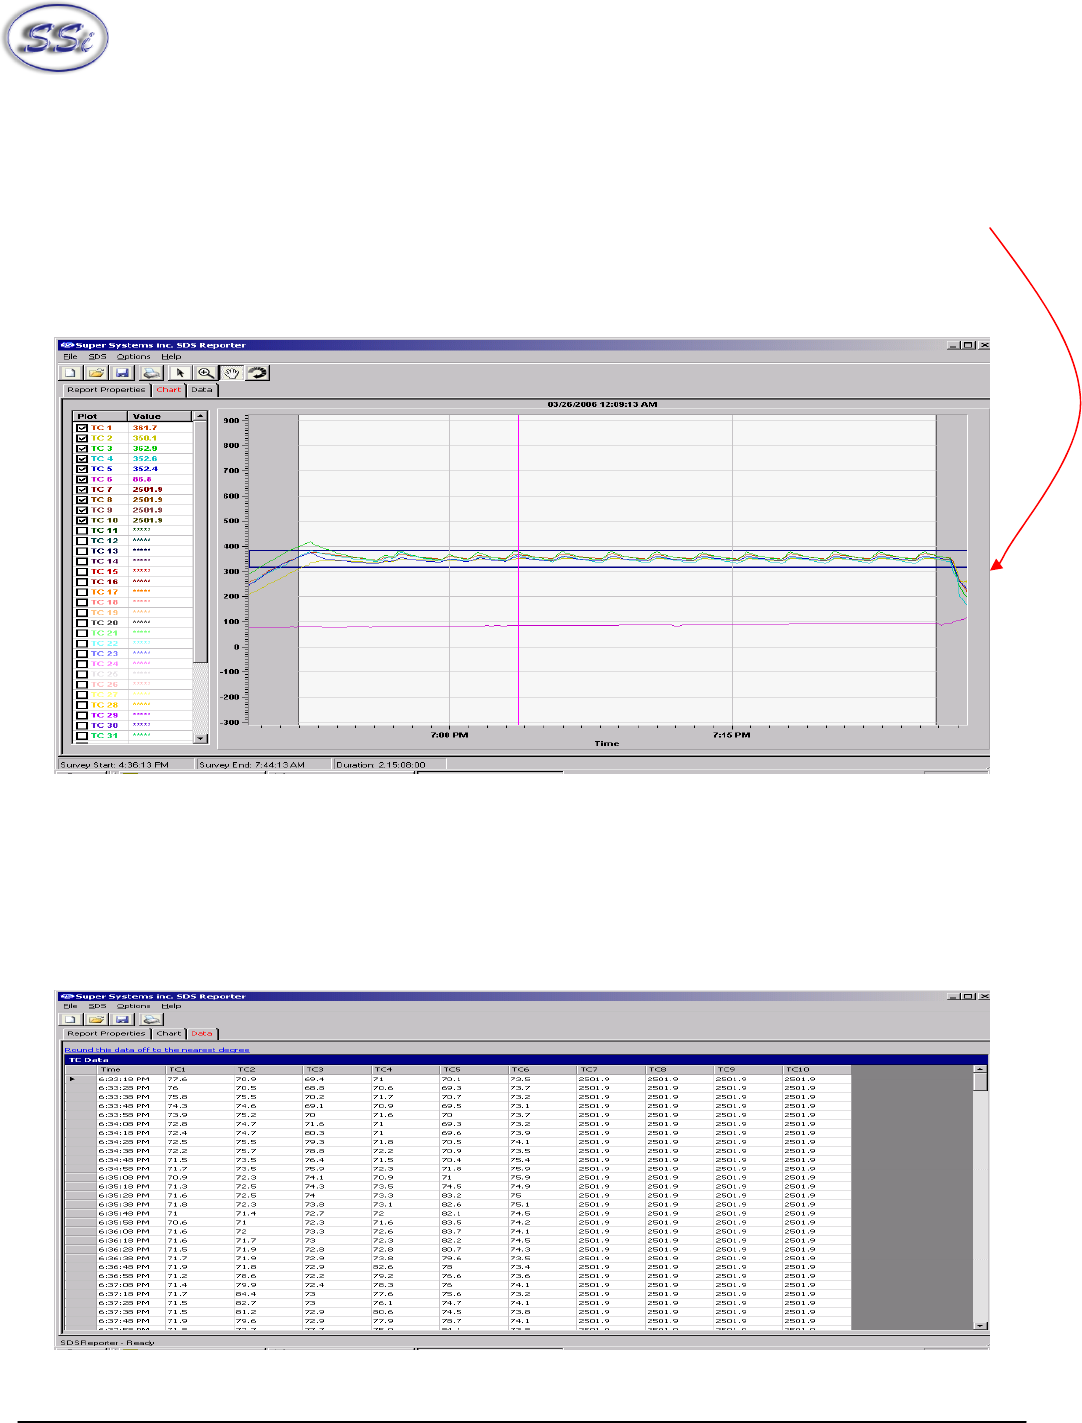
The Chart Tab (figure 2.21) contains the charted information from the time specified on the survey. This
tab is similar in design and function to the Real-Time chart (figure 2.40). When the chart tab is active,
the chart toolbar buttons also appear and these buttons can be used to zoom in on a section of the chart,
pan the chart up, down, left or right, and refresh the chart back to its original values. The screen will
display 2 horizontal lines that represent the high and low temperature tolerance levels based on the
setpoint. This display will change based on the tolerance level and setpoint defined in the Report
Parameters. For more information about the function of this screen, see the section “SDS Æ View
Real-time Data.”
Figure 2.21 Chart Tab
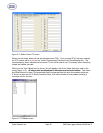
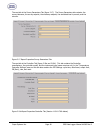
Note: checking or unchecking TCs on the Chart Tab will affect the Active TCs on the Report Properties –
Thermocouples tab.
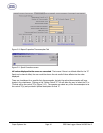
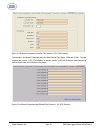
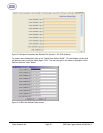
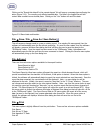
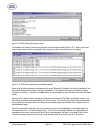
The Data Tab (figure 2.23) contains the data from each thermocouple for the each interval selected from
the Load Survey Data screen (figure 2.4).
Figure 2.23 Data Tab