Page 46
MSL600
Installation, Operation & Maintenance Manual
IP262/Z0, Rev. AB
February 2012
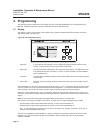
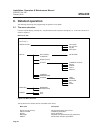
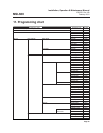
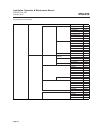
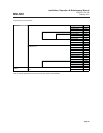
7.11 Readings and diagnostics parameters
The user can not alter the value of readings or diagnostics parameters within the MONITOR menu.
Note: A full menu structure is shown in section 11.
7.11.1 Readings parameters D800 to D834
7.11.1.1 Sludge Level - D800
The main process variable, the sludge blanket level in metres (feet – imperial).
Note:
If P629 Level offset is being used, this value will be added or subtracted from the normal sludge blanket level
and displayed as D800.
7.11.1.2 Target Range - D801
The actual distance from the transducer to the sludge blanket interface in metres (feet – imperial).
7.11.1.3 % Current Output - D805
Indicates % of current output
7.11.1.4 Current Output - D806
The actual current output in mA.
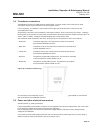
7.11.1.5 Relay Status - D820
This diagnostic parameter indicates the status of all the relays including relay three, the fault relay and relay
four, the compressor relay.
The relay status is indicated by a 1 or a 0. A 1 indicates the relay is energised, a 0 indicates the relay is de-
energised.
The display shows the state in the following format: 0000
Reading from left to right the first 0 is relay 1, the second 0 is relay 2, the third 0 is relay 3 and the fourth 0 is
relay 4.
7.11.1.6 RL * Runtime – (RL 1-D821, RL 2-D822, Cleaning time-824)
The total length of time in hours and minutes that a relay has been energised is monitored from this parameter.
Entering zero for the hours and minutes will reset the parameter.
7.11.1.7 Alarm Report - D830
When an alarm is detected then it can be viewed by accessing this parameter.
Press to highlight the first alarm report item. The user can step through the current active alarms using the n
and p keys.
7.11.1.8 Fault Report - D831
When a fault is detected then it can be viewed by accessing this parameter. In normal operation, the highest
priority active fault condition is also displayed in the lower display. Press to highlight the first fault report item.
The user can scroll through the current active faults using the n and p keys.