


Management and Diagnostic Console
126
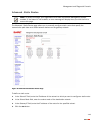
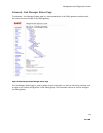
From the Filter pull-down menus, you can select the level of filtering you want to view (for example, DBG or
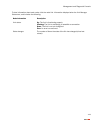
higher) and the specific gateway component that was affected. Each log displays the following information:
• Status level: DBG (debug), INF (informational), NTC (notice), WRN (warning), ERR (error), FTL (fatal), ALR
(alarm), or EMR (emergency).
• Timestamp (in days, hours, minutes, and seconds) since the state occurred. A “+” preceding the
timestamp designates that the timestamp occurred upon system startup. A time zone (such as “GMT”)
following the timestamp designates that the timestamp occurred after system startup.
• Module in which the state occurred (for example, “netdev”).
• Description of the log entry.
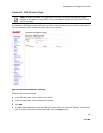
When you click
Insert Mark, a “placeholder” is inserted into the code string to mark where the error was
found.
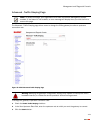
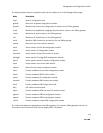
The following table lists the filters that can be applied.
Filter Description
(All) All log messages
aaal5 ATM AAL5 encapsulation
algaim AOL Instant Messenger ALG
algesp IPSec ESP ALG
algh323 H323 ALG
alghttp HTTP ALG
algintt Intoto Wrapper ALG
algmsgame Microsoft Game ALG
algmsn MSN Messenger ALG
algpptp PPTP ALG
algrtp RTP ALG
algrtsp RTSP ALG
algsip SIP ALG
algww Kineto QoS ALG
amon Application monitoring issues
atm ATM stack
cm Configuration Manager/configuration database
devfs Device files system