


38 C
HAPTER
4: A
DVANCED
M
ANAGEMENT
T
ASKS
Viewing
Performance
Statistics
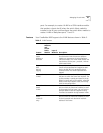
Device View enables you to display a variety of activity and error statistics
at device, segment, and port level. The statistics that are available depend
on the type of port or device that you select.
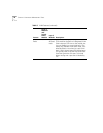
You can view statistics for the following 3Com devices:
■
CoreBuilder 2500 High-Function Switch
■
CoreBuilder 3500 High-Function Switch
■
CoreBuilder 9000 Enterprise Switch
■
CoreBuilder 9400 Gigabit Ethernet Switch
■
SuperStack II Switch 3900
■
SuperStack II Switch 9300
■
LANplex 2016 Switch
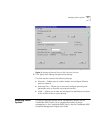
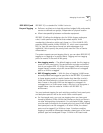
To display statistics for one of these devices:
1
Select a port.
2
From the shortcut menu, select one of the statistics options.
The available options depend on the type of port selected but include:
■
Port statistics — Shows graphs for inbound and outbound
counters (bytes and packets) that help you determine port traffic.
■
Bridge statistics — Show graphs for bridge port utilization
counters, such as Spanning Tree frames, multicast limit exceeds,
and same segment discards.
■
Switch statistics — Shows the ratio of forwarded to filtered
packets. This graph shows the effectiveness of switching in
managing the network traffic.
■
Error statistics — Shows graphs for various error statistics
depending on the type of port selected (ethernet or FDDI MAC).
■
Ring Utilization statistics — Shows utilization statistics for FDDI
MAC ports.
■
RMON statistics — Launches LANsentry
®
Manager, which consists
of an integrated set of applications that you can use to display and
explore the real-time and historical data captured by
RMON-compliant devices on the network. You can also configure
those devices from LANsentry Manager.