


1161221051L1-5, Issue 161221051L1-5A
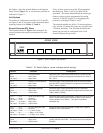
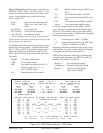
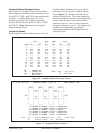
Figures 10 and 10A consolidate current information for
the HDSL / HDSL2, DSX-1, and DS1 interfaces. A key
to the information provided is found in the center of the
screen. Arrows indicate the key applies to both the
HTU-C and HTU-R.
LOSS Pulse Attenuation Measurement
SYNC HDSL Loop 1 and Loop 2 Sync
Status
ES 15M/24H Errored Seconds*
SES 15M/24H Severely Errored Seconds*
UAS 15M/24H Unavailable Seconds*
* The first number is for the current 15-minute period
and the second is the current 24-hour period (Loop 1 and
Loop 2 numbers are displayed).
An indication of Pair Reversal (if present) is given at the
bottom of the first key column. Loopback status for the
HTU-C, HRE, and HTU-R is indicated on these screens.
Status and configuration information for the DS1 and
DSX-1 signals is located in the center of the screen near
the bottom.
FRAME T1 Framing Format select
CODE T1 Line Code selected
LBO Line Build-Out selected (for DSX-1);
Customer signal of 0, -7.5, -15,
and -22.5 dB (for DS1)
NIU Network Interface Unit enabled?
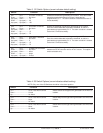
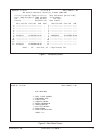
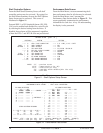
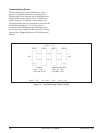
Figure 10A. HDSL Status Summary -HRE Screen
08/08/70 18:05:00 SUMMARY - [ SLOT 8 ] SHELF ADDRESS = 00
LOOP #1 <NETWORK> LOOP #2 ELAPSED TIME 00:14:17 LOOP #1 <CUSTOMER>LOOP #2
--------- HRE #1--------- --------- HRE #1---------
00 dB 00 dB <- LOSS -> 01 dB 01 dB
YES YES <- SYNC -> YES YES
000/00000 000/00001 <- ES 15M/24H -> 001/00001 001/00001
000/00000 000/00000 <- SES 15M/24H -> 000/00000 000/00000
001/00001 001/00001 <- UAS 15M/24H -> 006/00006 001/00001
LOOPBACK INACTIVE
HRE#1 NET SIGNAL QUALITY N = NETWORK SIDE RECEIVER HRE#1 CUST SIGNAL QUALITY
[X] 9 [X] C = CUSTOMER SIDE RECEIVER [X] 9 [X]
L[X] 8 L[X] L[X] 8 L[X]
O[X] 7 O[X] ____ LP1 ____ LP1 ____ ____ O[X] 7 O[X]
O[X] 6 O[X] |HTUC| |HRE1| |HRE2| |HTUR| O[X] 6 O[X]
P[X] 5 P[X] | |===N| |C===| |====| | P[X] 5 P[X]
[X] 4 [X] | | | | | | | | [X] 4 [X]
1[X] 3 2[X] | |===N| |C===| |====| | 1[X] 3 2[X]
[X] 2 [X] |____| |____| |____| |____| [X] 2 [X]
[X] 1 [X] LP2 LP2 [X] 1 [X]
[X] 0 [X] [X] 0 [X]
“P” - prev scrn, n”H” - element (0H=HTU-C/R, 1H=HRE1, 2H=HRE2)
“M” - main menu, “Z” - clr current reg, nn”S” - slot:
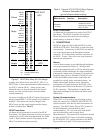
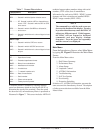
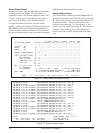
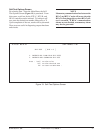
BVP Bipolar Violations detected (DSX-1 and
DS1)
ES Errored Seconds (DSX-1 and DS1)
SES Severely Errored Seconds (DSX-1 and
DS1)
UAS Unavailable Seconds (DSX-1 and DS1)
Alarms Lists current alarm condition status
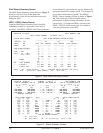
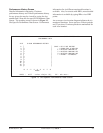
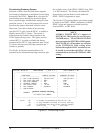
A measure of signal quality for each HDSL / HDSL2
loop is displayed in graphic form on the bottom right of
the screen. The measure is from 0 (poor signal quality)
to 9 (excellent signal quality). Guidelines for interpreting
the indicators are given below.
0 Noise margin is ≤ 0 dB (≈ 10
-7
BER)
1-8 Margin measurement above 10
-7
BER in dB
9 Margin is ≥ 9 dB above 10
-7
BER
Predicting performance based upon signal quality varies
with each loop. Generally, a noise margin of 0 or higher
will support a bit error rate of better than 10
-7
.
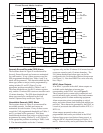
ADTRAN has defined the following as guidelines that
correspond to the operation of the HTU-C and HTU-R
faceplate LEDs labeled LP1 and LP2.
Margin < 0 Poor Loop Signal Quality
0 ≤ Margin ≤ 2 Marginal Loop Signal Quality
Margin > 2 Good Loop Signal Quality
(better than 10
-9
BER)