


Chapter 25: Network Statistics
312
Overview
Statistics provide important information for troubleshooting switch
problems at the port level. The AT-S110 Management Software provides a
versatile set of statistics charts that you can customize for your needs,
including (depending upon the chart) the ports whose statistics you want
to view and the color used to draw the chart.
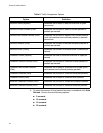
There are three types of statistics charts:
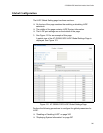
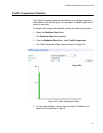
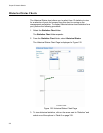
Traffic Comparison: The Traffic Comparison statistics chart allows you
to display a specified traffic statistic over all of the ports. You can
select 12 statistic types and 12 colors for each port. This chart is
described in “Traffic Comparison Statistics” on page 313.
Error Group: The Error Group chart displays the discard and error
counts for a specified port and is described in “Error Group Statistics”
on page 316.
Historical Status: This chart allows you to select from 12 statistics to
view for a selection of ports for however long this chart is running on
the management workstation. The Historical Status chart is described
in “Historical Status Charts” on page 318.