


65 Barracuda NG Network Access Client - Administrator’s Guide
By selecting this context menu entry on a selected entry all entries with the selected client
are displayed in a new tab. Criteria for identifying a computer is the computer's local
machine secure identifier (SID).
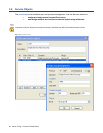
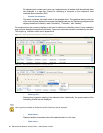
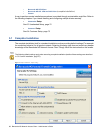
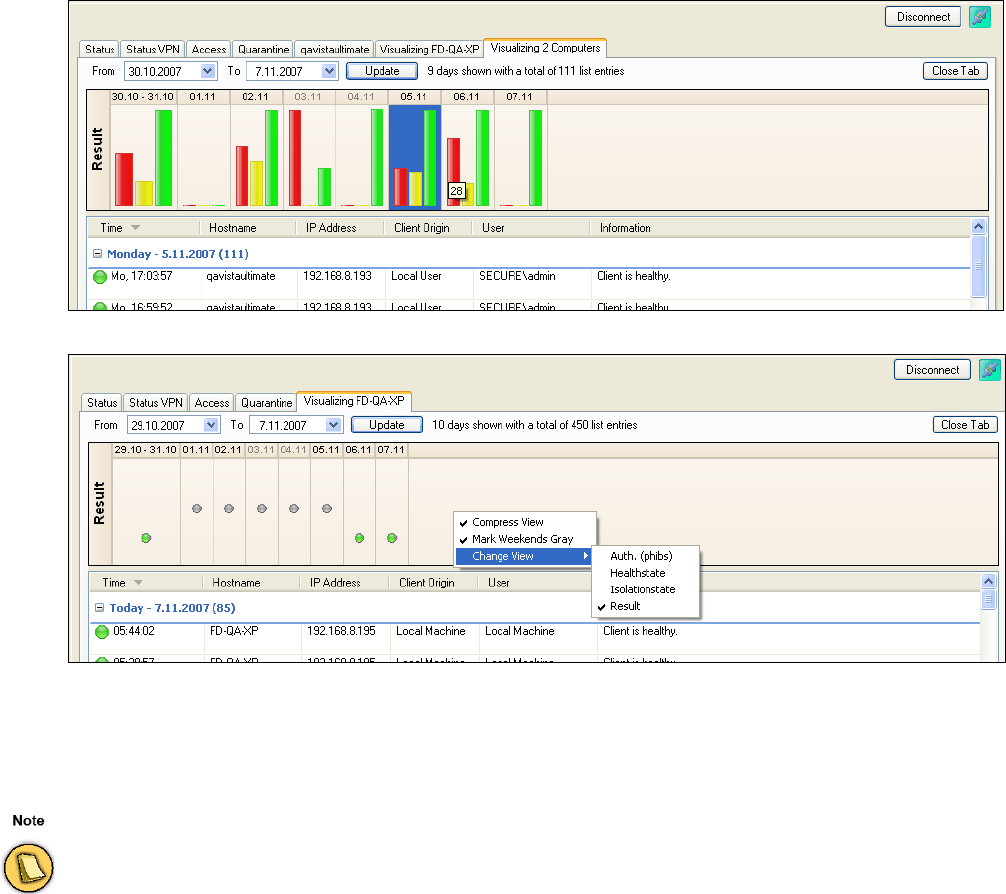
• Visualize this Computer …
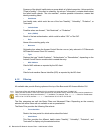
This entry visualizes the health state of the selected client. The graphical status at the top
of the main window displays the summarized health state per day. Selecting multiple entries
displays statistics of clients in state "Unhealthy", "Probation", and "Healthy".
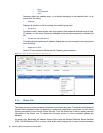
For single entries, the summary displays a red icon to indicate an unhealthy client if it was unhealthy
only once per displayed time period (day/week). Grey icons mean that no data is available for this date.
This might e.g. indicate a client that is powered off.
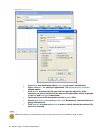
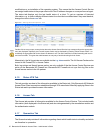
• Show Log File …
Displays the log entries relating to the selected client. Additionally, the access cache of the
forwarding firewall can be displayed.
• Show Details …
Displays detailed information about the selected client in a list view.
• Flush Cache >
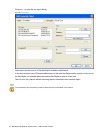
Fig. 4–1 Box – Monitoring and Real-time Information – Visualizing 2 Computers
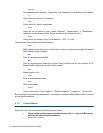
Fig. 4–2 Box – Monitoring and Real-time Information – Visualizing FD-QA-XP
Only log entries available on this Barracuda NG Firewall box will be displayed.