3-17
Cisco Performance Visibility Manager User Guide
OL-8620-03
Chapter 3 Monitor
Real-Time Charts
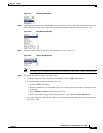
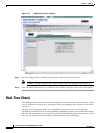
Figure 3-14 Real-Time Chart Hyperlink
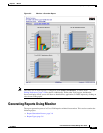
The Real-Time Chart pop-up opens and begins monitoring by displaying the Data Source and variable
selected in the original report, as shown in Figure 3-15.
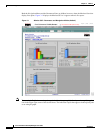
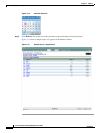
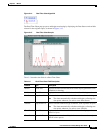
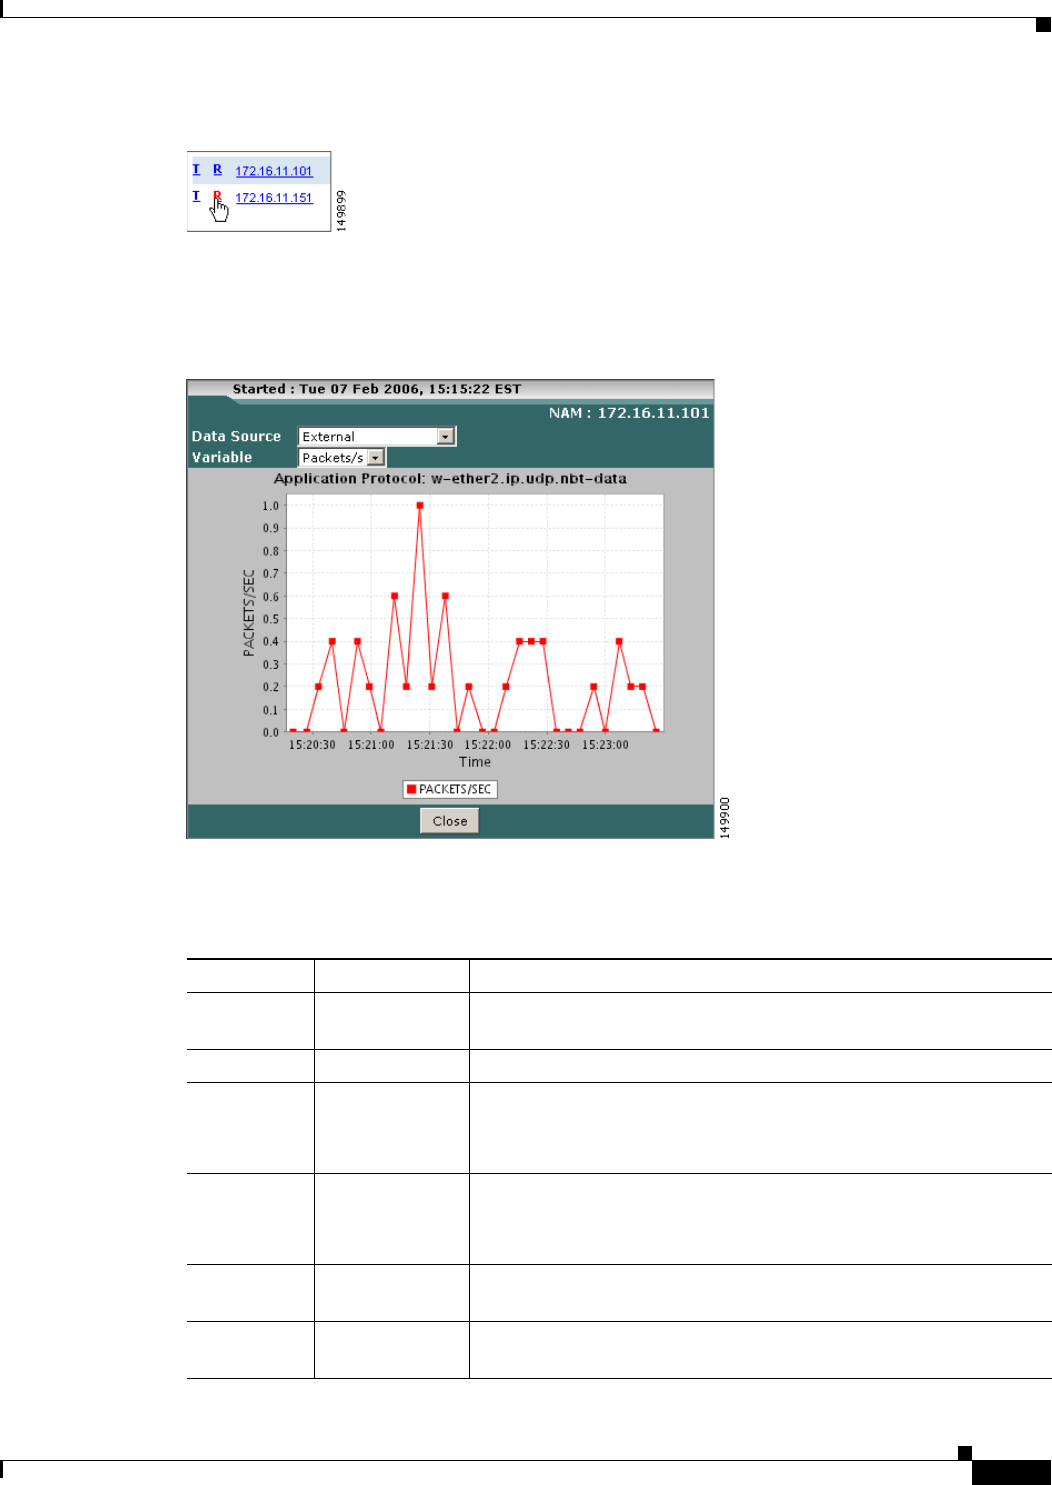
Figure 3-15 Real-Time Chart Sample
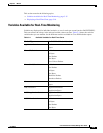
Table 3-5 describes the fields in a Real-Time Chart.
Table 3-5 Real-Time Chart Field Description
Element Type Description
Started Fixed Text Displays the date and time that the real-time display parameters were
submitted for charting.
NAM Fixed Text Displays the name of the NAM whose data flow is being monitored.
Data Source Drop-down List Allows selection of the desired NAM Data Source for monitoring.
Note The chart automatically refreshes and begins collecting new
data points whenever you select a new Data Source.
Variable Drop-down List Allows selection of the data type to monitor, such as packets or bytes.
Note The chart automatically refreshes and begins collecting new
data points whenever you select a new Variable.
Chart Y-Axis Fixed Text Displays the variable selected within the chart for display, such as
packets or bytes.
Chart X-Axis Dynamic Data Displays the current time of day in increments that continuously
refresh as time passes.