


3-6
Cisco Performance Visibility Manager User Guide
OL-8620-03
Chapter 3 Monitor
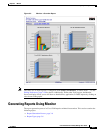
Generating Reports Using Monitor
• Monitor Parameters Pane, page 3-7
• Running a Report, page 3-8
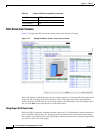
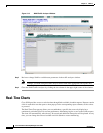
Report Generation Process
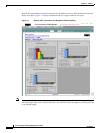
The Cisco PVM Monitor tab opens automatically after you log in to the system. To generate reports
under the Monitor tab:
1. Log in to Cisco PVM.
2. Allow the system to display the Progress Indicator and then the Monitor Overview report.
3. Open a report suite and select a report.
4. Open the parameters pane.
5. Select the data source group, data view, desired data source (if applicable), and report type.
6. Select the time or date range (if desired).
7. Click Run.
Note If you have not loaded any NAMs into Cisco PVM, you have removed them for some reason, or there
are no Data Source Groups available in the system, the Monitor Overview pane will display an error
indicating that no data is available to display the report. See Chapter 2, “Setup” for details on importing
NAMs and creating Data Source Groups.
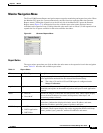
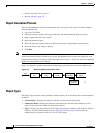
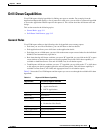
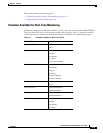
Figure 3-4 displays a graphic representation of the report generation process under the Monitor tab.
Figure 3-4 Monitoring Report Generation Flow
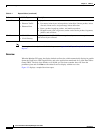
Report Types
The Report Type selection on the parameters window allows you to choose the data collection method
to display:
• Current Rates—Displays the statistics collected over the selected time period.
• Cumulative Rates—Displays the statistics collected for the selected report element since the
collection was created or within the selected time period.
• TopN—Displays the data collected for the TopN selected report elements, such as Hosts, VLANs,
or Hosts, over the selected time period. See Editing Preferences, page 2-50 for details on
configuring the system-wide value of N for all TopN reports.
Monitor
tab
Monitor
suite
Select
report
Monitor
parameters
Parameters
selection
Run
report
Login
149714