


3-18
Cisco Performance Visibility Manager User Guide
OL-8620-03
Chapter 3 Monitor
Trend Reports
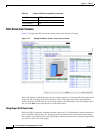
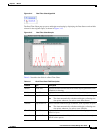
Note The chart refreshes and displays new data points every 30 seconds.
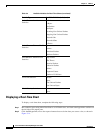
Step 3 Change the data being monitored by:
a. Selecting a desired Data Source from the drop-down list.
b. Selecting a desired Variable from the drop-down list.
The chart refreshes automatically and begins to display a new set of data points based on the new
Data Source or Variable selections.
Note Clicking Close terminates data refresh and closes the chart window.
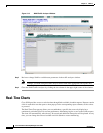
Trend Reports
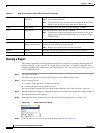
Cisco PVM provides dynamic performance reporting capability within the Reports GUI by displaying a
link to a Trend Report on each report pane. The report displays raw data for the selected network
component (such as protocol, host, or interface) with a superimposed line showing the data trend over
time, offering a magnified view of the data flow for analysis of abnormal or problematic patterns.
To see different statistics for the same report displayed as a Trend report, simply click a different metric
within the report display (such as PACKETS or BYTES) and the chart automatically refreshes.
This section contains the following topics:
• Trend Statistics, page 3-18
• Displaying a Trend Report, page 3-19
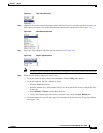
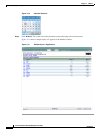
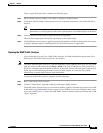
Trend Statistics
Trend reports are available from tabular reports (those showing Current Rates or Cumulative Data) for
the following statistics:
• Applications
• Interface
• Ethernet Traffic
• Ethernet Errors
• Conversations
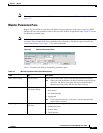
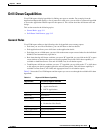
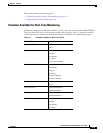
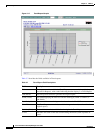
Chart Body Dynamic Data Displays a line graph with demarcated points that continuously
refresh as the time increments pass.
Close Button Closes the chart pop-up window.
Table 3-5 Real-Time Chart Field Description (continued)
Element Type Description