


6
Principled Technologies, Inc.: Initial investment payback analysis: Dell PowerEdge R710
solution with VMware ESX vs. HP ProLiant DL385 solution
Our results show the advantage in performance, cost, and workload consolidation that modern hardware, OSs,
hypervisors, and database software can offer over legacy hardware and software solutions for this workload.
Test results
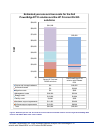
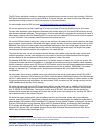
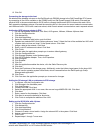
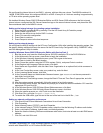
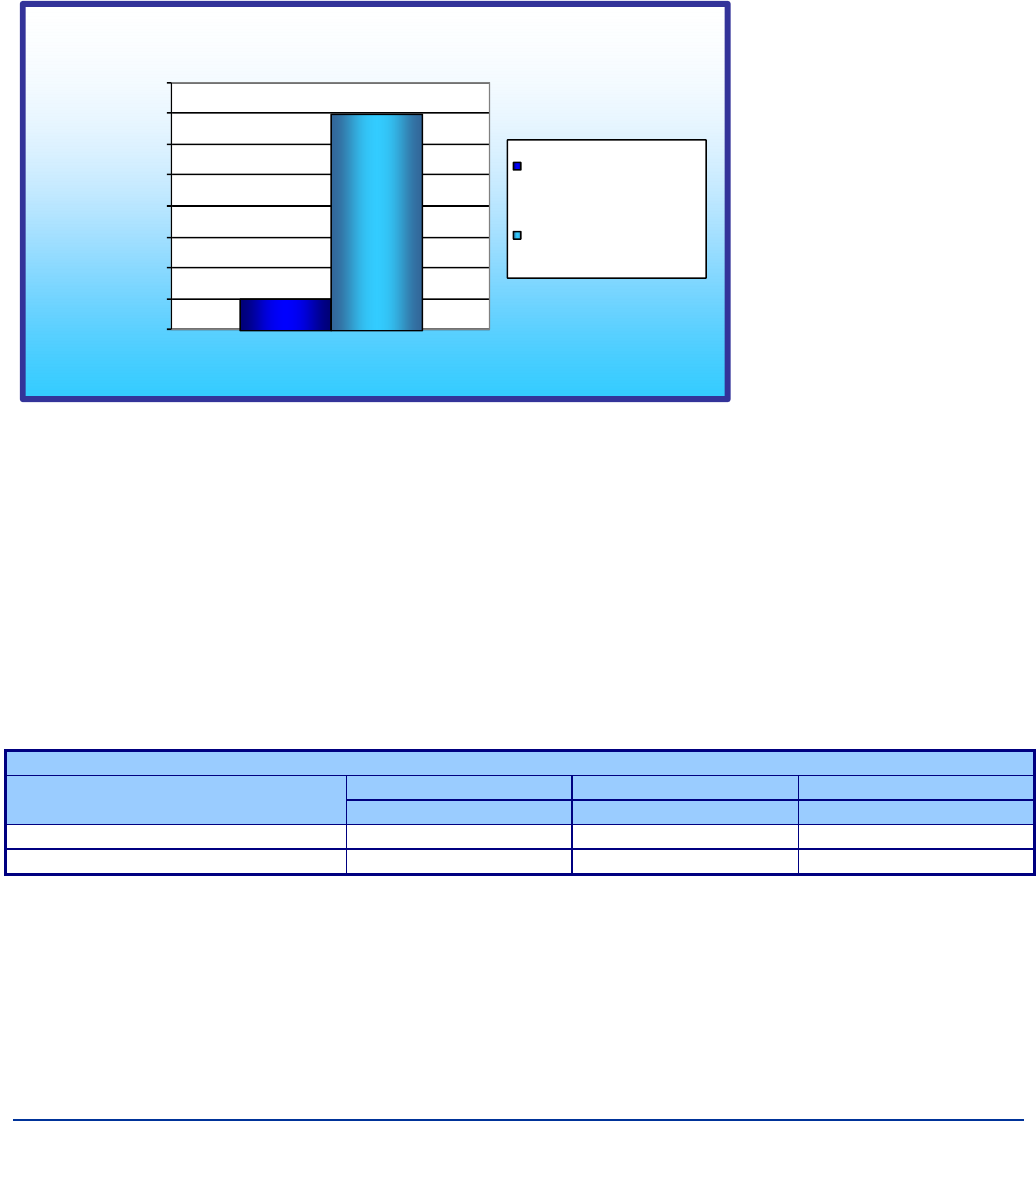
Figure 4 illustrates the
number of virtual machines
the Dell PowerEdge R710
solution can sustain
compared to the HP
ProLiant DL385 solution.
The Dell PowerEdge R710
solution delivered seven
virtual servers that each
produced higher OPM
results than the single
physical HP ProLiant DL385
solution.
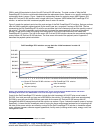
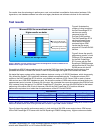
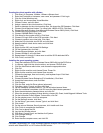
Figure 5 shows the specific
performance results, in both
OPM and CPU percentage,
for the Dell PowerEdge
R710 server with the Dell
EqualLogic PS6000 storage
solution and the HP ProLiant
DL385 server with the HP
StorageWorks MSA30 storage solution while running the DVD Store tests. Results are from the test run that
produced the median of three OPM results. Lower CPU percentage and higher OPM numbers are better.
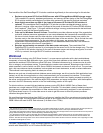
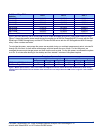
We tested the legacy system with a single database instance running a 10 GB DS2 database, which alone nearly
fully utilized the system’s CPU; additional instances yielded unacceptable results. To achieve maximum DS2
results on the Dell PowerEdge R710 solution, we installed one instance of SQL Server 2008 on each of seven
VMs and ran one 10GB DS2 database on each. We show the number of OPM each solution achieved during our
measurement period, minutes 24 through 29 of the test. We calculated the scores by averaging the OPM for each
SQL instance during that period. For the Dell PowerEdge R710 solution, we show the OPM results for the lowest
performing of the seven VMs. Each of the seven VMs on the Dell PowerEdge R710 solution delivered
performance equivalent to or better than the performance of the HP ProLiant DL385.
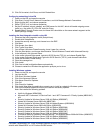
Figure 6 shows the specific performance results, in both individual VM OPM scores and minimum OPM scores,
for the Dell PowerEdge R710 server with the Dell EqualLogic PS6000 storage array. Higher numbers are better.
0
1
2
3
4
5
6
7
8
Number of virtual machines
Microsoft SQL Server workload results
Higher results are better
HP ProLiant DL385 with
HP StorageWorks MSA30
Dell PowerEdge R710 with
Dell EqualLogic PS6000
Server and storage solution
Figure 4: Number of virtual machines for the Dell PowerEdge R710 solution and HP ProLiant
DL385 solution. Higher numbers are better.
Performance
Run 1 Run 2 Run 3
Minimum OPM Minimum OPM Minimum OPM
HP ProLiant DL385 solution 15,864.5 14,466.8 15,849.3
Dell PowerEdge R710 solution 16,029.3 15,360.9 15,036.6
Figure 5: Minimum per database OPM performance results per server or virtual server for the Dell PowerEdge R710 solution and the
HP ProLiant DL385 solution while running the DVD Store workload. Higher OPM numbers are better.