Viewing Device Information 2-23
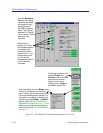
The MultiSwitch 700 Device View
Description
A text description of the interface: e.g., Ethernet Frontpanel (for the standard
Ethernet front panel interfaces), Fast Ethernet (for front panel Fast Ethernet
interfaces), FTM Backplane (for the backplane interfaces to the chassis), Host or
Host Data Port for the on-board i960 Host interface, and ATM, or FDDI, for an
installed modular interface.
Physical Status
Displays the current physical status — or operational state — of the interface:
Online or Offline.
Logical Status
Displays the current logical status — or administrative state — of the interface:
Up or Down.
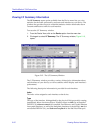
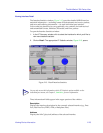
Interface Performance Statistics/Bar Graphs
The statistical values (and, where available, the accompanying bar graphs) to the
right of the interface description fields provide a quick summary of interface
performance. You can select the statistical value you want to display and the units
in which you want those values displayed by using the two menu fields directly
above the interface display area, as follows:
1. In the right-most menu field, click on the down arrow and select the unit in
which you wish to display the selected statistic: Load, Raw Counts, or Rate.
2. Once you have selected the base unit, click on the down arrow in the left-most
field to specify the statistic you’d like to display. Note that the options available
from this menu will vary depending on the base unit you have selected.
After you select a new display mode, the statistics (and graphs, where applicable)
will refresh to reflect the current choice, as described below.
Raw Counts
The total count of network traffic received or transmitted on the indicated
interface since device counters were last reset. Raw counts are provided for the
following parameters:
In Octets Octets received on the interface, including framing
characters.
In Packets Packets (both unicast and non-unicast) received by the
device interface and delivered to a higher-layer protocol.
NOTE
Bar graphs are only available when Load is the selected base unit; if you select Raw
Counts or Rate, the Bar Graph column will be removed from the interface display.


