47
Chapter 5: Using the Web-based Utility for Configuration
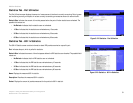
Statistics Tab - RMON History
WebView Switches
Log Table
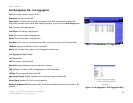
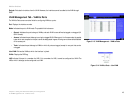
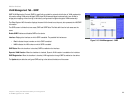
Source Interface. Displays the interface from which the history samples were taken.
Sampling Interval. Indicates the time in seconds that samplings are taken from the port.
Sampling Requested. Displays the number of samples to be saved. The field range is 1-65535. The default value
is 50.
Current Number of Samples. Displays the current number of samples taken.
View History Table button. This button opens the RMON History screen.
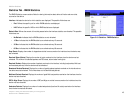
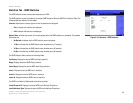
RMON History
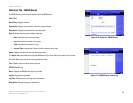
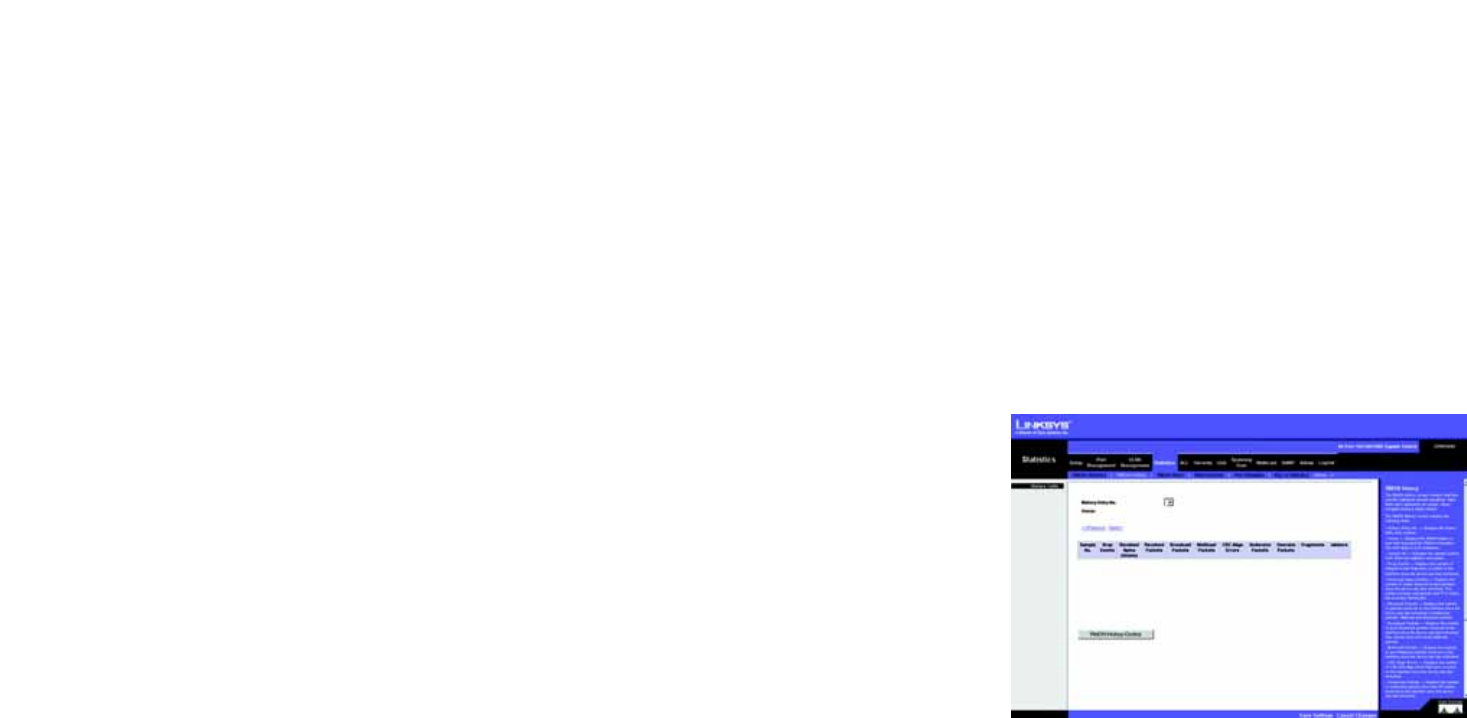
The RMON History screen contains interface specific statistical network samplings. Each table entry represents
all counter values compiled during a single sample.
History Entry No. Displays the history table entry number.
Owner. Displays the RMON station or user that requested the RMON information. The field range is 0-20
characters.
Sample No. Indicates the sample number from which the statistics were taken.
Drop Events. Displays the number of dropped events that have occurred on the interface since the device was
last refreshed. This option is not available on the SRW224G4 and SRW248G4.
Received Bytes (Octets). Displays the number of octets received on the interface since the device was last
refreshed. This number includes bad packets and FCS octets, but excludes framing bits.
Received Packets. Displays the number of packets received on the interface since the device was last
refreshed, including bad packets, Multicast and Broadcast packets.
Broadcast Packets. Displays the number of good Broadcast packets received on the interface since the device
was last refreshed. This number does not include Multicast packets.
Multicast Packets. Displays the number of good Multicast packets received on the interface since the device
was last refreshed.
CRC Align Errors. Displays the number of CRC and Align errors that have occurred on the interface since the
device was last refreshed.
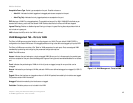
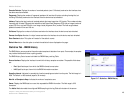
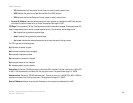
Figure 5-18: RMON History Table


