


88 SunFDDI/P 1.0 Adapter User’s Guide—May1997
8
The pf_stat utility displays information using column headings that conform
to SMT revision 7.3, which differ from SMT revision 5.1 and 4.2 headings in the
following cases:
• The ECM heading corresponds to the 5.1 MIM heading.
• The RMT heading does not have an analog in SMT revision 4.2. If you run
SunFDDI/P at revision level 4.2, ignore any data displayed under the RMT
heading of pf_stat.
Displaying Local Interface Statistics
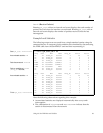
When you enter the pf_stat command without the -m option, it displays
statistics recovered from the local interface pf<inst>.
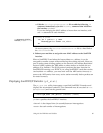
For example, to display the accumulated statistics for the interface pf0, type:
You can also monitor the interface dynamically (active monitor), by specifying
the interval (the elapsed time between interrogations) and count (the total
number of interrogations). This displays the incremental difference between
the current state and the previous state. The minimum interval is one second
and the accumulated statistics are displayed after every tenth interrogation.
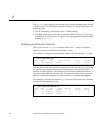
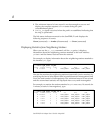
For example, to monitor the interface pf0 once every 60 seconds for 3 minutes
(a total of 3 interrogations), type:
# <basedir>/pf_stat pf0
Ring ECM RMT PCMS Ring_OP XmitP RecvP
UP IN RING_OP ACTIVE c 16fde 1862d
# <basedir>/pf_stat pf0 60 3
Ring ECM RMT PCMS Ring_OP XmitP RecvP
UP IN RING_OP ACTIVE c 131a0 131aa
UP IN RING_OP ACTIVE000
UP IN RING_OP ACTIVE011