


4-22
C
H
A
P
T
E
R
4:
M
A
N
A
G
I
N
G
Y
O
U
R
H
U
B
U
S
I
N
G
Q
U
I
C
K
C
O
N
F
I
G
M
A
N
A
G
E
R
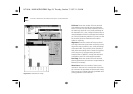
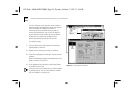
Unicast
Shows the percentage of readable frames
received that are addressed to single devices.
Multicast
Shows the percentage of readable frames
received that are addressed to multiple devices. The
total number of multicast frames is normally a small
percentage of the value seen for unicast (single
address) frames. A high level of multicast frames can
adversely affect network performance.
Broadcast
Shows the percentage of frames received
which are addressed to all devices. The total number
of broadcast frames is normally a small percentage of
the value seen for unicast (single address) frames. A
high level of broadcast frames can adversely affect
network performance.
The values shown in the Frame Types pie chart are
per poll period, not per second. To change the poll
period, see
“Accessing the Hub” on page 4-6
.
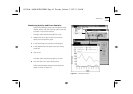
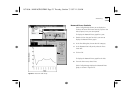
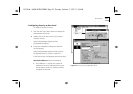
Network Traffic Statistics
Quick Config Manager allows you to display the
network traffic as a percentage of the total possible
traffic for a port or the hub (all ports) in any one time
period.
To display the Network Traffic graph for a port:
1
Double-click on the port for which you want to
display the Network Traffic graph.
2
In the Port dialog box, choose the
Info
category.
3
In the Repeater Port Info panel, select the
Traffic
check box.
4
Click on
OK
.
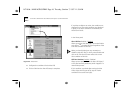
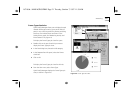
To display the Network Traffic graph for the hub:
■
From the
View
menu, select
Traffic
.
Quick Config Manager displays the Network Traffic
graph, as shown in
Figure 4-9
. The values shown in
the Network Traffic graph are the average per poll
period. To change the poll period, see
“Accessing the
Hub” on page 4-6
.
16710.bk : MANAGING.FRM Page 22 Tuesday, October 7, 1997 11:38 AM