


22
WATLOW Series 945
How to Use Data Communications
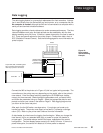
Data Logging
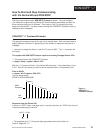
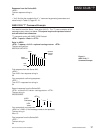
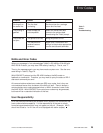
Figure 11 -
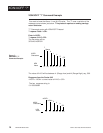
Table Printout
Example.
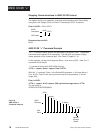
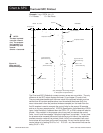
SPC - Statistical Process Control
SPC tracks variability to help you distinguish between natural variability (common
causes) from unnatural variability (special causes). Based upon measurements,
SPC gives you a picture of how the process is performing. By showing when
special causes are occurring, the SPC printout gives you written changes in the
process. An SPC printout is a picture of the operation. Typically, past data gives
information about what the average measurements and limits should be. These
are traditionally shown by upper and lower control limits. It also gives us a picture
of what is happening now. By comparing the process we can determine when
special, or assignable causes occur. This is advanced user-level material and
requires previous experience with Statistical Process Control (SPC).
For more information we recommend:
Juran's Quality Control Handbook
by J.M. Juran, Editor in Chief & Frank M. Gryna, Associate Editor
Hardcover, 1988 ISBN: 0-7-033176-6
Available from: McGraw Hill
1221 Avenue of the Americas
New York, NY 10020
1-800-2-MCGRAW
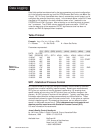
Data fields emitted are determined by the tag parameters and control configuration.
As in the following example, tag is set for PSA (Process, Set Points, and Alarm Set
Points). SET-2 is only transmitted when there is a secondary control output, and is
configured the same as the primary output. In the example below, notice A1LO was
changed to 125 resulting in an alarm condition shown as an * (asterisk) in the
PROCESS and LOW-1 columns. After a latching or non-latching alarm is cleared,
the * is removed. The ATUNE column reports the auto-tune status. START de-
notes the beginning of the sequence, RSTRT signifies auto-tune has been re-
started, and END is displayed when complete.
Table Printout
Example: Log = On, Int = 0.5, tag = PSA
P = Process S = Set Points A = Alarm Set Points
Parameters represented:
(C1) (SP1) (SP2) (A1LO) (A1HI) (A2LO) (A2HI) (AUt)
DATE: 01-01-92
TIME PROCESS SET-1 SET-2 LOW-1 HIGH-1 LOW-2 HIGH-2 ATUNE
10:03:47 144 * 200 150 * 240 190 * 210
10:03:58 157 * 200 150 240 190 * 210 START
10:04:34 185 * 200 150 240 190 * 210
10:05:10 177 * 200 150 240 190 * 210
10:05:46 182 * 200 150 240 190 * 210
10:06:02 179 * 200 150 240 190 * 210 END
10:06:38 196 200 150 240 190 210
10:07:14 198 200 150 240 190 210
10:07:50 199 200 150 240 190 210
10:08:26 199 200 150 240 190 210
10:09:02 200 200 150 240 190 210