


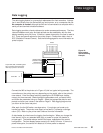


How to Use Data Communications
23
WATLOW Series 945
SPC
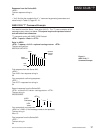
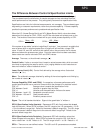
The Difference Between Control & Specification Limits
Control limits are established on the control chart at ± 3 standard deviations (3 sigma).
They are based upon the distribution of sample averages and are calculated from the
actual performance of the process. They are typically narrower than specification limits.
Specifications are limits for individual measurements, not averages. They are based upon
engineering or customer requirements, rather than process capability. Process capability
predicts the process performance to predetermined specification limits.
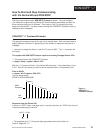
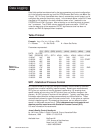
When the LCL (Lower Control Limit) and UCL (Upper Control Limit) values have been
determined, the values for CPKL, CPKU, and CP are calculated and printed once on the
chart. The smaller of these two numbers will be your actual process capability or CPK.
If the system is too stable "variation insignificant" is printed. Your process is so stable that
even a severe shift or variation greater than ±6 sigma will still maintain a larger CPK
value. If both LSL and USL are left at their default value, they are set to the 4σ values
below and above the process mean value. Once the mean value has been calculated,
these values are used to calculate CPKL and CPKU values.
Average: The mean, or the arithmetic average, ( x ).
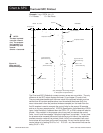
Control Limits: Limits on a control chart, based on actual process data, which are used
as criteria for signalling the need for action, or for judging whether a set of data does or
does not indicate a "state of statistical control."
Lower Control Limit (LCL): Control limit derived by the average minus 3 standard
deviation ( x - 3σ ).
Mean: The arithmetic average, obtained by adding all the values together and dividing by
the number of values ( x ).
Process Capability (CPKL and CPKU): A comparison of process performance with
product specifications over a period of time and while the process is in statistical control.
CPK < 0 Average value is outside the specification limits
CPK between 0 and 1 Variation is greater than the limits.
CPK = 1 Variation and the specification limits are the same
CPK between 1 and 1.33 Acceptable process control
CPK between 1.33 and 2 Good process control
CPK > 2 Excellent process control
Sigma: The unit of standard deviation. Sigma is the greek letter "s" written σ.
SPCA (Specification limits Absolute): Represents SPC with fixed values that do not
track the set point. When SPCA is chosen, the USL range is the LSL parameter + 2 (LSL
+ 2) to the sensor's range high. Default is the sensor's default range high. The LSL range
is from the sensor's default range low to the sensor's default range high. Default is the
sensor's default range low.
SPCd (Specification limits Deviation): Represents SPC with deviation values that
follow changes to the set point. When SPCd is chosen the range for USL it will be nu-
meric values from 1 to 99. Default is 10. The LSL range is from -1 to -99. Default is -10.
SPCn : There are no user defined values. The USL and LSL parameters are masked.
CPKL =
Mean - LSL
3σ
CPKU =
USL - Mean
3σ