


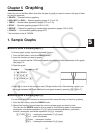

5-3
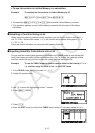
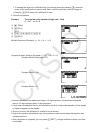
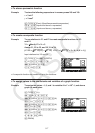
S To make V-Window settings
1. From the Main Menu, enter the GRAPH mode.
2. Press (V-WIN) to display the V-Window setting screen.
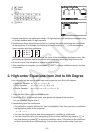
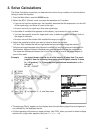
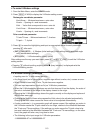
Rectangular coordinate parameter
Xmin/Xmax … Minimum/maximum
x-axis value
Xscale … Spacing of
x-axis increments
Xdot … Value that corresponds to one
x-axis dot
Ymin/Ymax … Minimum/maximum
y-axis value
Yscale … Spacing of
y-axis increments
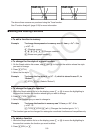
Polar coordinate parameter
T
Q
min/T
Q
max ... Minimum/maximum T,
Q
values
T
Q
ptch ... T,
Q
pitch
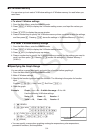
3. Press A to move the highlighting and input an appropriate value for each parameter,
pressing U after each.
•{INIT}/{TRIG}/{STD} … V-Window {initial settings}/{initial settings using specified angle
unit}/{standardized settings}
•{STO}/{RCL} … V-Window setting {store}/{recall}
After settings are the way you want them, press ) or )(QUIT) to exit the V-Window
setting screen.
• Pressing U without inputting anything while I (busy indicator) is displayed exits the
V-Window setting screen.
S V-Window Setting Precautions
• Inputting zero for T
Q
ptch causes an error.
• Any illegal input (out of range value, negative sign without a value, etc.) causes an error.
• When T
Q
max is less than T
Q
min, T
Q
ptch becomes negative.
• You can input expressions (such as 2P) as V-Window parameters.
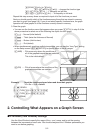
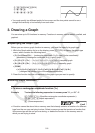
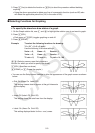
• When the V-Window setting produces an axis that does not fit on the display, the scale of
the axis is indicated on the edge of the display closest to the origin.
• Changing the V-Window settings clears the graph currently on the display and replaces it
with the new axes only.
• Changing the Xmin or Xmax value causes the Xdot value to be adjusted automatically.
Changing the Xdot value causes the Xmax value to be adjusted automatically.
• A polar coordinate (
r =) or parametric graph will appear coarse if the settings you make in
the V-Window cause the T
Q
ptch value to be too large, relative to the differential between
the T
Q
min and T
Q
max settings. If the settings you make cause the T
Q
ptch value to be
too small relative to the differential between the T
Q
min and T
Q
max settings, on the other
hand, the graph will take a very long time to draw.
• The following is the input range for V-Window parameters.
–9.999999999
E
97 to 9.999999999
E
97