


6-29
When there is a list specified for the [Resid List] item on the Setup screen, regression formula
residual data is automatically saved to the specified list after the calculation is finished.
• You cannot draw a graph for LinearReg
t Test.
• [Save Res] does not save the
B
&
R
conditions in line 2.
• When the list specified by [Save Res] is the same list specified by the [Resid List] item on the
Setup screen, only [Resid List] data is saved in the list.
I Ƶ
2
Test
• Ƶ
2
Test Common Functions
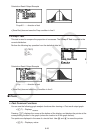
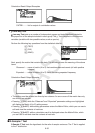
You can use the following graph analysis functions after drawing a graph.
•(CHI) ... Displays C
2
value.
Pressing (CHI) displays the C
2
value at the bottom of the display, and displays the pointer at
the corresponding location in the graph (unless the location is off the graph screen).
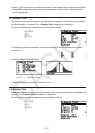
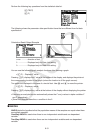
•(P) ... Displays
p-value.
Pressing (P) displays the
p-value at the bottom of the display without displaying the pointer.
• Executing an analysis function automatically stores the C
2
and p values in alpha variables C
and P, respectively.
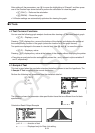
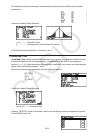
• Ƶ
2
GOF Test (Ƶ
2
one-way Test)
The C
2
GOF Test (Ƶ
2
one-way test) tests whether the frequency of sample data fits a certain
distribution. For example, it can be used to determine conformance with normal distribution or
binomial distribution.
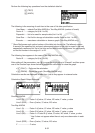
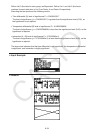
Perform the following key operations from the statistical data list.
(TEST)
(CHI)
(GOF)
Next, specify the lists that contain the data. The following shows the meaning of the above
items.
Observed...... name of List (1 to 26) that contains observed counts (all cells positive
integers)
Expected....... name of List (1 to 26) that is for saving expected frequency
CNTRB ......... Specifies a list (List 1 to List 26) as the storage location of the contribution
of each observed count obtained as calculation results.