


8-27
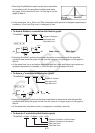
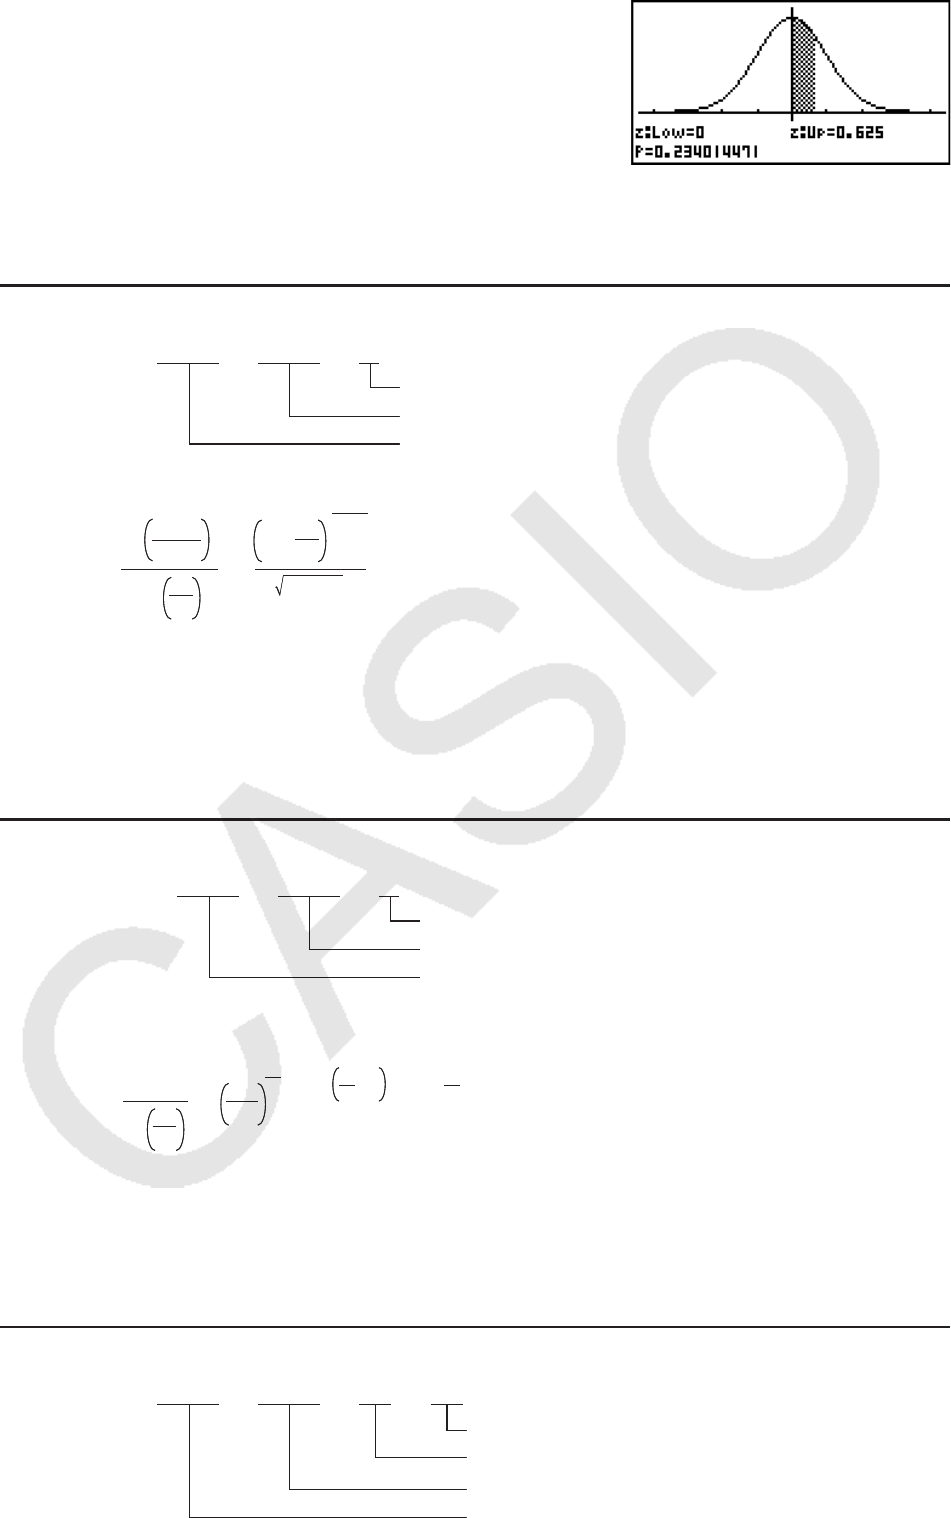
• Executing DrawDistNorm performs the above calculation
in accordance with the specified conditions and draws
the graph. At this time the ZLow x ZUp region on the
graph is filled in.
• At the same time, the
p, ZLow, and ZUp calculation result values are assigned respectively to
variables
p, ZLow, and ZUp, and p is assigned to Ans.
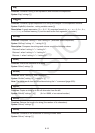
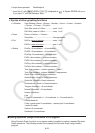
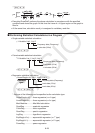
• To draw a Student-t cumulative distribution graph
DrawDistT <Lower>, <Upper>, <df>
Degree of freedom
Data upper limit
Data lower limit
• Executing DrawDistT performs the above calculation in accordance with the specified
conditions and draws the graph. At this time the Lower
x Upper region on the graph is
filled in.
• At the same time, the
p calculation result value and the Lower and Upper input values are
assigned respectively to variables p, tLow, and tUp, and p is assigned to Ans.
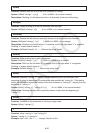
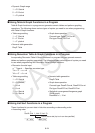
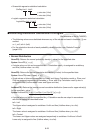
• To draw a Ƶ
2
cumulative distribution graph
DrawDistChi <Lower>, <Upper>, <df>
Degree of freedom
Data upper limit
Data lower limit
• Executing DrawDistChi performs the above calculation in accordance with the specified
conditions and draws the graph. At this time the Lower
x Upper region on the graph is
filled in.
• At the same time, calculation result
p is assigned to variables p and Ans.
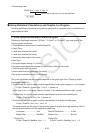
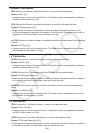
• To draw an F cumulative distribution graph
DrawDistF <Lower>, <Upper>, <ndf>, <ddf>
Degrees of freedom of denominator
Degrees of freedom of numerator
Data upper limit
Data lower limit
tLow = Lower tUp = Upper
2
df +1
df
x
2
1+
df +1
2
p =
–
2
df
dx
df
Upper
Lower
tLow = Lower tUp = Upper
2
df +1
df
x
2
1+
df +1
2
p =
–
2
df
dx
df
Upper
Lower
1
p =
2
df
df
2
df
2
2
1
dxx
–1
x
2
e
–
Upper
Lower
1
p =
2
df
df
2
df
2
2
1
dxx
–1
x
2
e
–
Upper
Lower