


20051101
10-1
Using the Graph Analysis Tools to Graph Data
10 Using the Graph Analysis Tools to Graph Data
Graph Analysis tools make it possible to analyze graphs drawn from sampled data.
k Accessing Graph Analysis Tools
You can access Graph Analysis tools using either of the two methods described below.
uu
uu
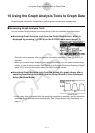
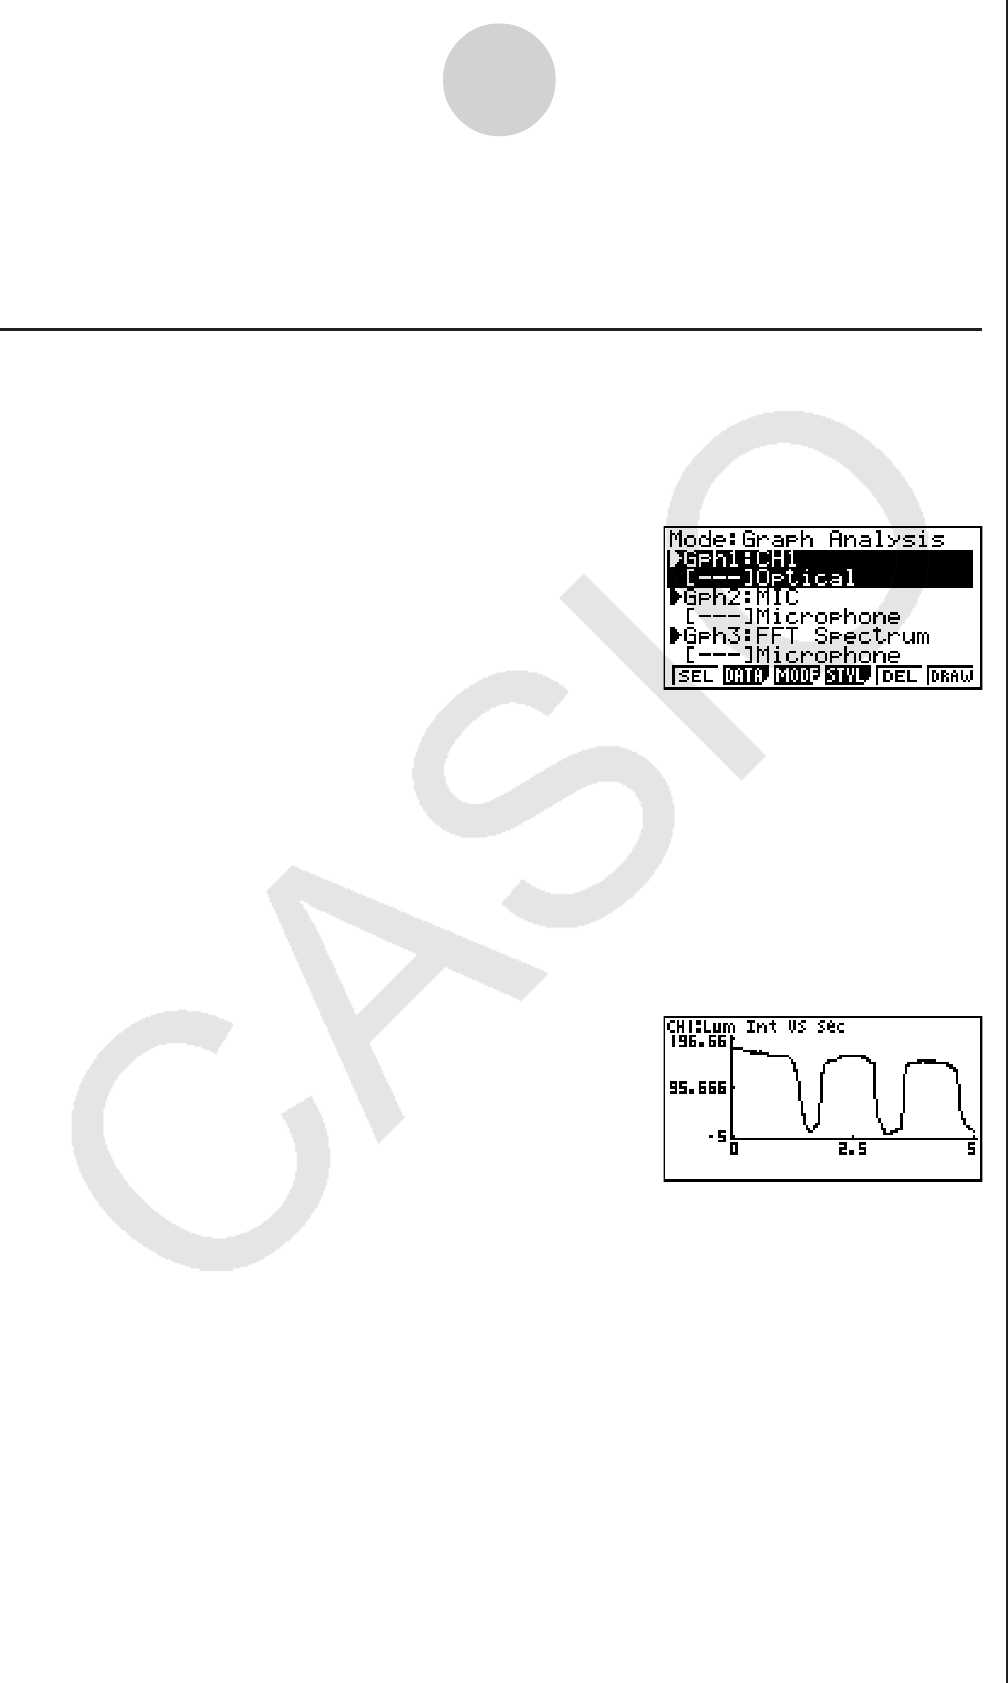
u Accessing Graph Analysis tools from the Graph Mode screen, which is
displayed by pressing 5(GRPH) on the E-CON2 main menu (page 1-1)
• The main menu appears after you perform a sampling operation. Press 5(GRPH) at
that time.
• When you access Graph Analysis tools using this method, you can select from among a
variety of other Analysis modes. See “Selecting an Analysis Mode and Drawing a Graph”
(page 10-2) for more information about the other Analysis modes.
uu
uu
u
Accessing Graph Analysis tools from the screen of a graph drawn after a
sampling operation is executed from the Setup Wizard or from Advanced
Setup (Realtime Mode)
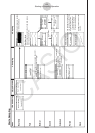
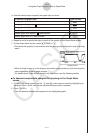
Graph Mode Screen
• In this case, data is graphed after the sampling operation is complete, and the calculator
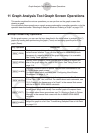
accesses Graph Analysis tools automatically. See “Graph Screen Key Operations” on
page 11-1.
Graph Screen