


20051101
k Selecting an Analysis Mode and Drawing a Graph
This section contains a detailed procedure that covers all steps from selecting an analysis
mode to drawing a graph.
Note
• Step 4 through step 6 are not essential and may be skipped, if you want. Skipping any
step automatically applies the initial default values for its settings.
• If you skip step 2, the default analysis mode is the one whose name is displayed in the
top line of the Graph Mode screen.
uu
uu
u
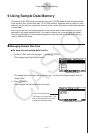
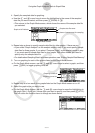
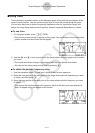
To select an analysis mode and draw a graph
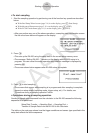
1. On the E-CON2 main menu (page 1-1), press 5(GRPH).
• This displays the Graph Mode screen.
2. Press 3(MODE), and then select the analysis mode you want from the menu that
appears.
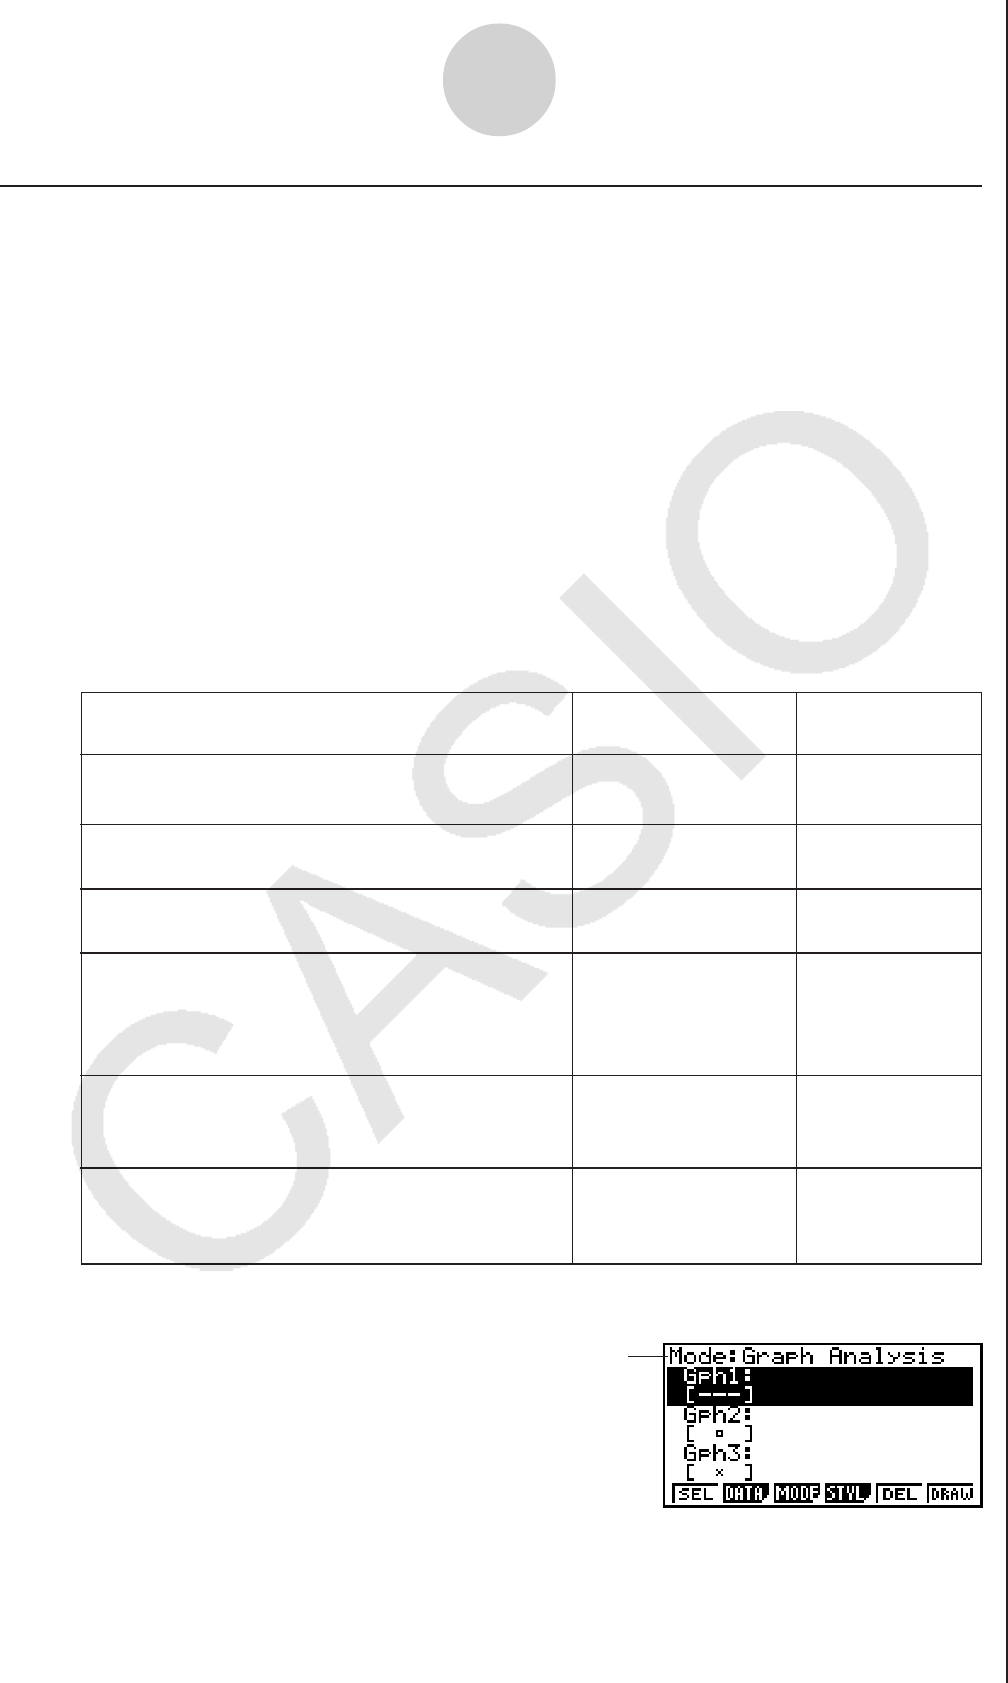
• The name of the currently selected mode appears in the top line of the Graph Mode
screen.
10-2
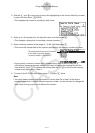
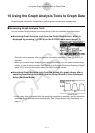
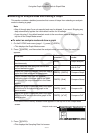
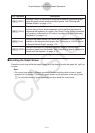
Using the Graph Analysis Tools to Graph Data
Analysis mode name
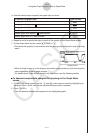
3. Press 2(DATA).
• This displays the Sampling Data List screen.
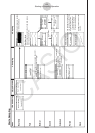
Graph three sets of sampled data
simultaneously
[Norm]
Perform this menu
operation:
To do this:
To select this
mode:
Graph Analysis
Graph sampled data along with its first and
second derivative graph
[diff] d/dt & d
2
/dt
2
Display the graphs of different sampled data in
upper and lower windows for comparison
[CMPR]/[GRPH]
Compare Graph
Output sampled data from the speaker,
displaying graph of the raw data in the upper
window and the output waveform in the lower
window
[CMPR]/[Snd] Compare Sound
Display the graph of sampled data in the upper
window and its first derivative graph in the
lower window
[CMPR]/[d/dt] Compare d/dt
Display the graph of sampled data in the upper
window and its second derivative graph in the
lower window
[CMPR]/[d
2
/dt
2
] Compare d
2
/dt
2