


6-33
p ....................... p-value
df ..................... degrees of freedom
SS ..................... sum of squares
MS ................... mean squares
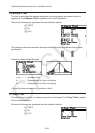
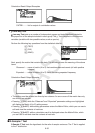
With Two-Way ANOVA, you can draw Interaction Plot graphs. The number of graphs depends
on Factor B, while the number of X-axis data depends on the Factor A. The Y-axis is the
average value of each category.
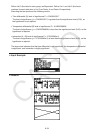
You can use the following graph analysis function after drawing a graph.
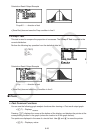
•(Trace) or (TRCE) ... Trace function
Pressing B or C moves the pointer on the graph in the corresponding direction. When there
are multiple graphs, you can move between graphs by pressing D and A.
• Graphing is available with Two-Way ANOVA only. V-Window settings are performed
automatically, regardless of Setup screen settings.
• Using the Trace function automatically stores the number of conditions to alpha variable A
and the mean value to variable M, respectively.
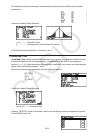
I ANOVA (Two-Way)
S Description
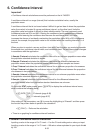
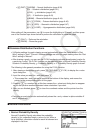
The nearby table shows measurement results for a metal product produced by a heat
treatment process based on two treatment levels: time (A) and temperature (B). The
experiments were repeated twice each under identical conditions.
Perform analysis of variance on the following null hypothesis, using a significance level of 5%.
H
o
: No change in strength due to time
H
o
: No change in strength due to heat treatment temperature
H
o
: No change in strength due to interaction of time and heat treatment temperature
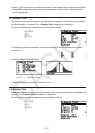
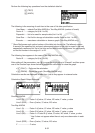
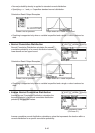
S Solution
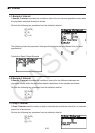
Use Two-Way ANOVA to test the above hypothesis.
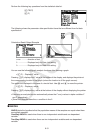
Input the above data as shown below.
List1={1,1,1,1,2,2,2,2}
List2={1,1,2,2,1,1,2,2}
List3={113,116,139,132,133,131,126,122}
B (Heat Treatment Temperature) B1 B2
A1 113 , 116
133 , 131
139 , 132
126 , 122
A2
A (Time)
B (Heat Treatment Temperature) B1 B2
A1 113 , 116
133 , 131
139 , 132
126 , 122
A2
A (Time)