11-22
Cisco ONS 15310-MA SDH Reference Manual, Release 9.1 and Release 9.2
78-19417-01
Chapter 11 Performance Monitoring
Performance Monitoring for Ethernet Cards
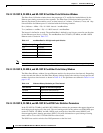
11.6.1.2 CE-100T-8, CE-MR-6, and ML-100T-8 Card Ether Ports Utilization Window
The Ether Ports Utilization window shows the percentage of Tx and Rx line bandwidth used by the
Ethernet ports during consecutive time segments. The Ether Ports Utilization window provides an
Interval drop-down list that enables you to set time intervals of 1 minute, 15 minutes, 1 hour, and 1 day.
Line utilization for Ethernet ports is calculated with the following formulas:
Rx = (inOctets + inPkts * 20) * 8 / 100% interval * maxBaseRate
Tx = (outOctets + outPkts * 20) * 8 / 100% interval * maxBaseRate
The interval is defined in seconds. The maxBaseRate is defined by raw bits per second in one direction
for the Ethernet port (that is, 1 Gbps). The maxBaseRate for CE-100T-8, CE-MR-6, and ML-100T-8
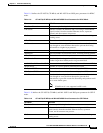
Ethernet cards is shown in Table 11-7.
Note Line utilization numbers express the average of ingress and egress traffic as a percentage of capacity.
11.6.1.3 CE-100T-8, CE-MR-6, and ML-100T-8 Card Ether Ports History Window
The Ether Ports History window lists past Ethernet statistics for the previous time intervals. Depending
on the selected time interval, the Ether Ports History window displays the statistics for each port for the
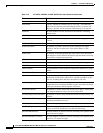
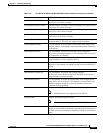
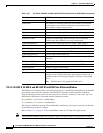
number of previous time intervals as shown in Table 11-8. The parameters are defined in Table 11-6 on
page 11-20.
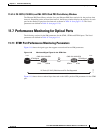
11.6.1.4 CE-100T-8, CE-MR-6, and ML-100T-8 Card POS Ports Statistics Parameters
In the CE-100T-8, CE-MR-6, and ML-100T-8 POS Ports window, the parameters that appear depend on
the framing mode employed by the cards. The two framing modes for the packet-over-SDH (POS) port
on the CE-100T-8, CE-MR-6, and ML-100T-8 cards are high-level data link control (HDLC) and
frame-mapped generic framing procedure (GFP-F). For more information on provisioning a framing
mode, refer to Cisco ONS 15310-MA SDH Procedure Guide.
The POS Ports statistics window lists POS parameters at the line level.
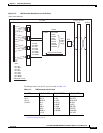
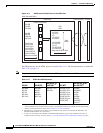
Table 11-7 maxBaseRate for VC high-order path Circuits
VC high-order path maxBaseRate
VC3 51840000
VC4 155000000
VC4-2c 311000000
VC4-4c 622000000
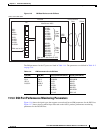
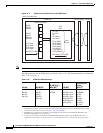
Table 11-8 Ethernet History Statistics per Time Interval
Time Interval Number of Intervals Displayed
1 minute 60 previous time intervals
15 minutes 32 previous time intervals
1 hour 24 previous time intervals
1 day (24 hours) 7 previous time intervals


