


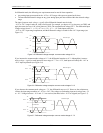
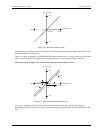
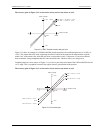

The accuracy plots in Figure 3-12 are drawn for clarity and are not drawn to scale.
-10V
+10V
Input Voltage
0
16383
A
ctual
Ideal
Output Code
Gain error = +0.02% or +2 mV
Gain error = -0.02%, or -2 mV
8192
Figure 3-12. ADC Transfer function with gain error
Figure 3-12 shows an example of a UMDAS 0802DA transfer function with a calibrated gain error of ±0.02%, or
±2 mV. This means that at full scale, neglecting the effect of offset for the moment, the measurement would be
within 2 mV of the actual value. Note that gain error is expressed as a ratio. Values near ±FS are more affected
from an absolute voltage standpoint than are values near mid-scale, which see little or no voltage error.
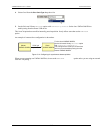
Combining these two error sources in , we have a plot of the error band of the UMDAS 0802DA for the
±10 V range. This is a graphical version of the typical accuracy specification of the product.
Figure 3-13
Figure 3-13. Error band plot
The accuracy plots in Figure 3-13 are drawn for clarity and are not drawn to scale
-10V
+10V
Input Voltage
0
16383
2.44 mV
8192
Output Code
Ideal
Ideal +2.44 mV + 2 mV
Ideal -(2.44 mV + 2 mV)
Ideal -(2.44 mV + 2 mV)
Ideal
Ideal +2.44 mV + 2 mV
3-10
UMDAS 0802DA User's Guide Functional Details