


ColdFire V1 Full Chip Simulation Connection
FCS Tutorials
666
Microcontrollers Debugger Manual
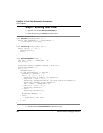
/*** Processor Expert internal initialization. DON'T REMOVE THIS
CODE! ***/
PE_low_level_init();
/*** End of Processor Expert internal initialization. ***/
/*Write your code here*/
for(;;) {
(void)PWM1_SetRatio16(pwmRatio);
}
/***Processor Expert end of main routine. DON'T MODIFY THIS CODE!***/
for(;;);
/***Processor Expert end of main routine. DON'T WRITE CODE BELOW!***/
} /*** End of main routine. DO NOT MODIFY THIS TEXT! ***/
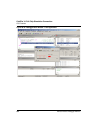
Step 10 - Run
The application is now finished and we can launch it. Make sure you have chosen the Full
Chip Simulation connection.
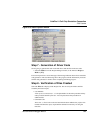
1. Select the Debug icon in the Project Manager window (or the menu bar Project >
Debug or [F5]).
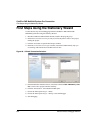
2. Select Component > Open in the debugger and open the VisualizationTool
component.
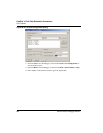
VisualizationTool Properties
In this tutorial we will create a visualization using the VisualizationTool window. Make
sure that you are in the Edit mode (Right mouse click > Edit Mode or [Ctrl-E]).
1. Select Right mouse click > Properties
2. For Refresh Mode, select CPU Cycles
3. For Cycle Refresh Count, select 10000
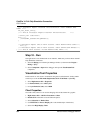
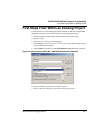
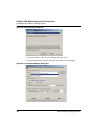
Chart Properties
Now add a chart, where we can see the changing value of the channel in a graphic.
1. Right mouse click > Add New Instrument > Chart
2. Double click on the Chart to see the Chart Properties.
3. Select Subscribe for Kind of Port
4. Use PIM.PTA0 for Port to Display (this is the simulated pin of the device)
5. Select 2 for High Display Value