STARTERKIT MB91360
Chapter 3 Getting Started
© Fujitsu Microelectronics Europe GmbH - 13 - UG-910006-13
3.2 Softune Workbench Debugging Introduction
Whenever you have successfully created a valid load module, you may switch from the
development mode to the debugging mode of Softune Workbench.
Basically, there are 3 types of debugging systems supported :
1. The software simulator: This type of debugger is always present and does not
require any special hardware extensions. The simulator will cover the FR-core
features, but no peripheral functions. Therefore, you can use the simulator to
verify program flow, check for dynamic errors, look at the generated assembler
code and so on.
2. The monitor debugger: This debugger type requires an evaluation board like the
MB91360 Starterkit connected to one of the COM-ports of your PC. Therefore,
make sure you have the evaluation board connected and powered-up as
described before. Explanations in this manual refer to the monitor debugger only.
3. The emulator debugger: The in-circuit-emulator (ICE) is a system, which allows a
connection to any target system using a probe-cable. The appropriate system for
the MB91360 series is the MB2197-01 system. More information about this
system can be found on the Fujitsu Micros CD-ROM or on our website.
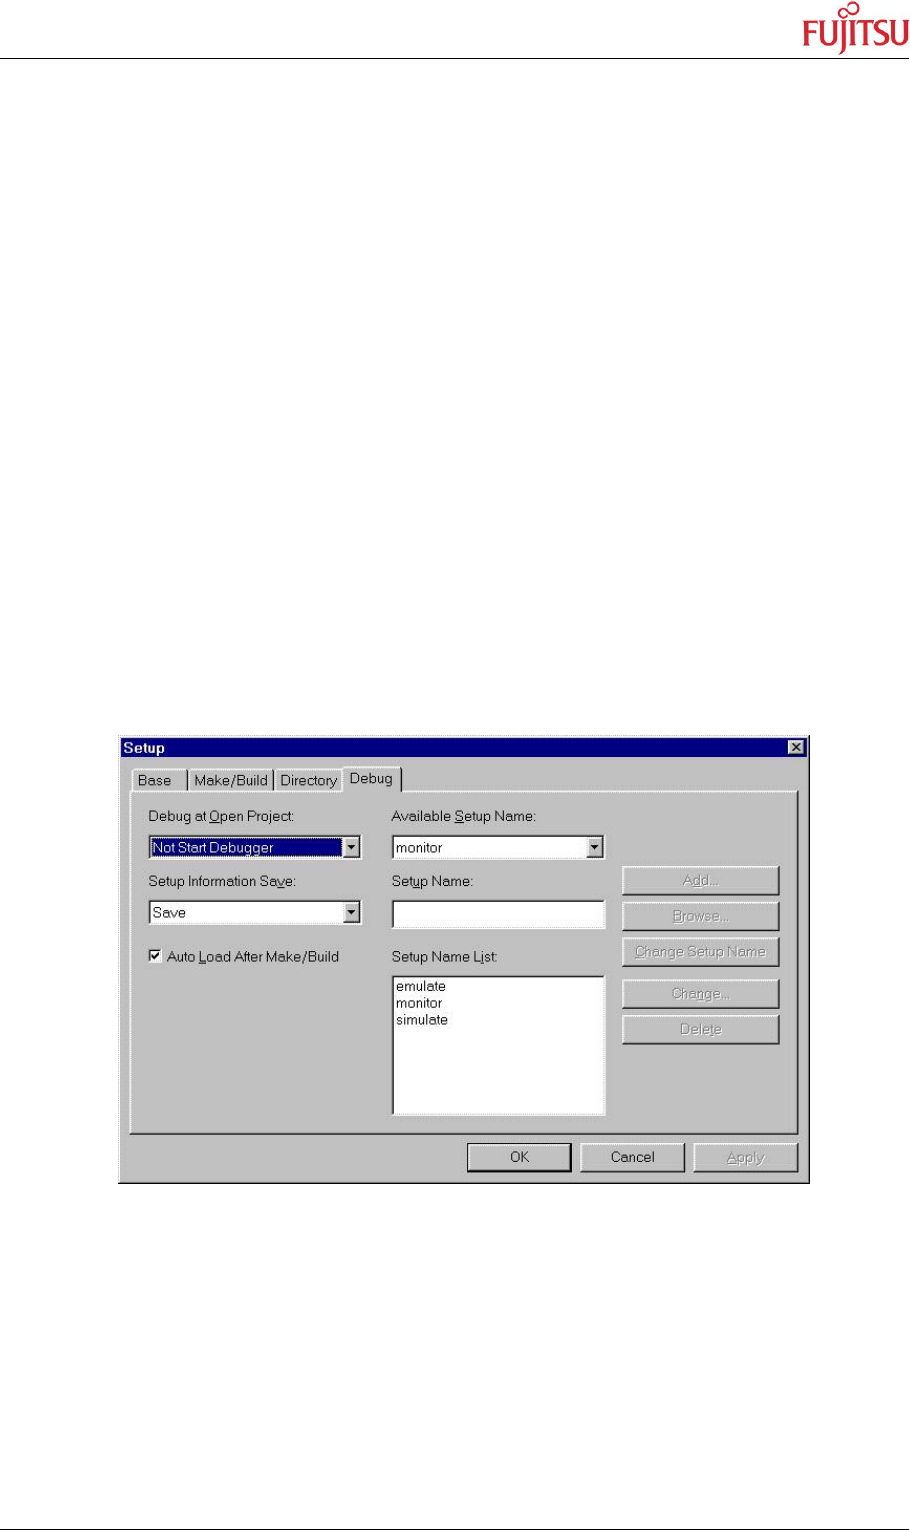
Which debugger is used for the actual project can be configured in the “Project – Setup –
Debug” menu:
Always verify the settings before you start debugging a new project ! The current “setup” is
indicated by the selected item in the “Available Setup Name” dropdown-box. The provided
examples contain 3 setups (simulate, emulate and monitor). Ensure “monitor” is selected.
Click on “monitor” in the “Setup Name List” and click “Change”. A debug setup wizard will
appear to guide you through the possible settings.
Make sure you are using the right COM-port number and Baudrate !
The default-settings for the monitor-debugger are fixed to :
COM-Port1 and 38400 Baud. Change the settings if necessary.
