


140
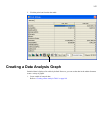
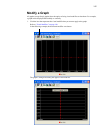
Visual Modifiers
Modifiers may be used singularly, or in conjunction with other modifiers, to change the orientation and
scale of the graph displayed.
With the use of display modifiers, the data displayed can be:
• Horizontal/Vertical
• Stacked/side-by-side
• Standard/Logarithmic
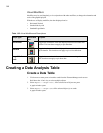
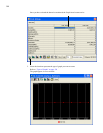
Creating a Data Analysis Table
Create a Data Table
1. Click on one or more ports or interface cards from the Element Manager main screen.
Hold down the <Cntrl> key to select multiple objects.
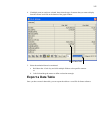
2. Select
Report-> Graph Port…
if the selected set of objects are ports.
A graph window opens.
3. Select
Report-> Graph Card
if the selected object (s) are cards.
A graph window opens.
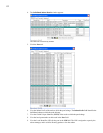
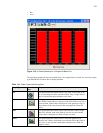
Table 13-2: Visual Modifiers and Descriptions
Graph Type Associated
Icon
Purpose
Horizontal
Toggles the orientation of the data displayed between horizontal and
vertical. This icon does not apply to pie chart data.
Stacked
Toggles the placement of data displayed between side-by-side and
top-to-bottom. This icon does not apply to pie or line chart data.
Logarithmic
scale
Toggles the numeric scale from standard increments to logarithmic.
This icon does not apply to pie chart data.